I’m fortunate enough to be attending this third international conference on Learning Analytics (I made an attempt at live blogging the second, last year here) hosted by University of Leuven

Here’s the official site with abstracts etc
1. Learning Analytics as Middle Space
Dan Summers described the conference theme; ‘The Middle Space’
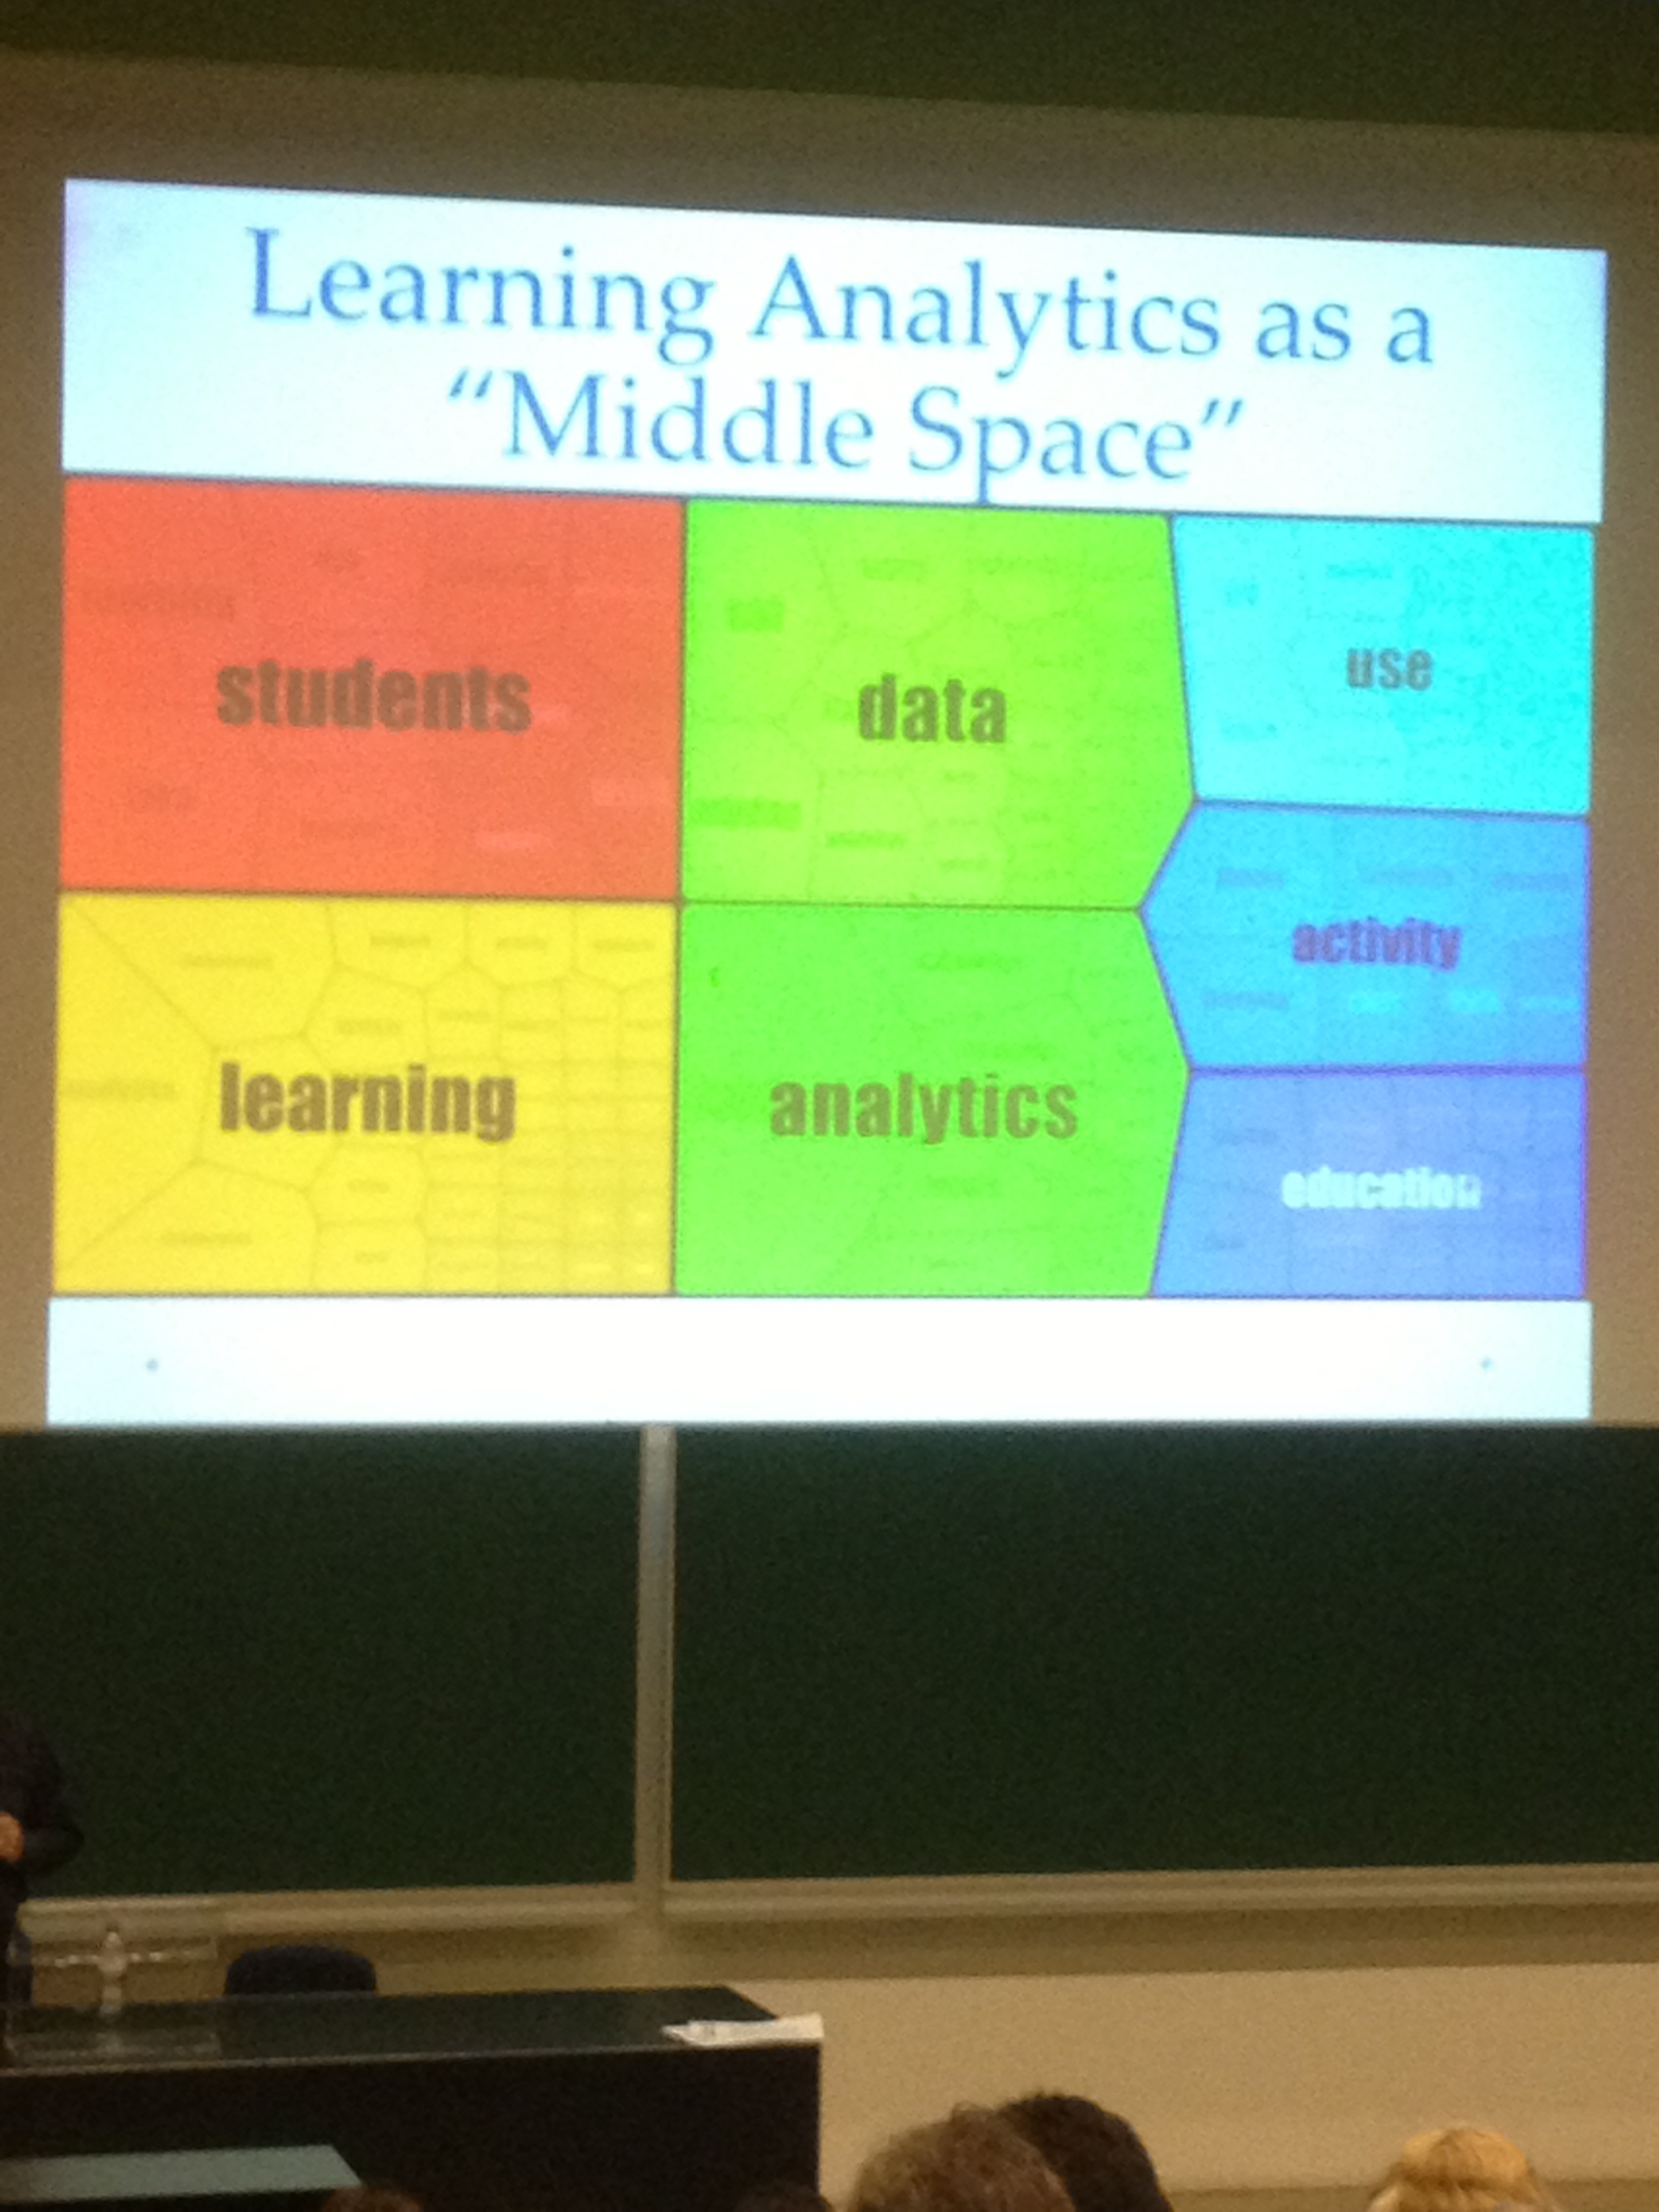
The conference will explore the “middle space” within which Learning and Analytics intersect, and seeks proposals for papers and events that explicitly connect analytic tools to theoretical and practical aspects of understanding and managing learning.
2. Marsha Lovett Cognitively Informed Analytics to Improve Teaching and Learning
First up we have a keynote by Marsha;
Marsha Lovett
Dr. Marsha Lovett is Director of the Eberly Center for Teaching Excellence and a Teaching Professor in the Department of Psychology, both at Carnegie Mellon University. Throughout her career, Dr. Lovett has been deeply involved in both local and national efforts to understand and improve student learning. Her book How Learning Works: 7 Research-Based Principles for Smart Teaching distills the research on how students learn into a set of fundamental principles that instructors can use to guide their teaching. Dr. Lovett has also developed several innovative, educational technologies to promote student learning and metacognition, including StatTutor and the Learning Dashboard.
Marsha poses the question ‘How do we tell how well our students are learning?’
Quizzes, homework performance, comparing to previous students / classes etc are traditional ways. Analytics offers new ways giving better and fuller insights into learning performance.
In a rich modern course experience by a well respected tutor Marsha found that ‘Students spend 100 + hours across the term yet show only learning gains of 3%’ and asks ‘what improvements can be made by applying analytics as an adaptive, data driven course ‘ and found that 18% learning gain occurred in less than 50 hours.
I have to applaud Marsha for giving us some concrete quantitative evidence for performance changes, something that has been lacking in the majority of analytics projects in my experience.
Marsha makes the point that analytics allows predictions and greater understanding but this is only useful if it creates targeted action. This is an aspect we at Jisc built into our definition of analytics and something I preach – analytics is only as good as the actions one takes. See our Analytics Series for more.
Marsha proposes three key ingredients to good learning analytics being;
1. Informed by cognitive theory
Where we’d expect to see a straigh line between errors made and practice attempts in a learning setting (the more practice, the less errors. Marsha shows the reality
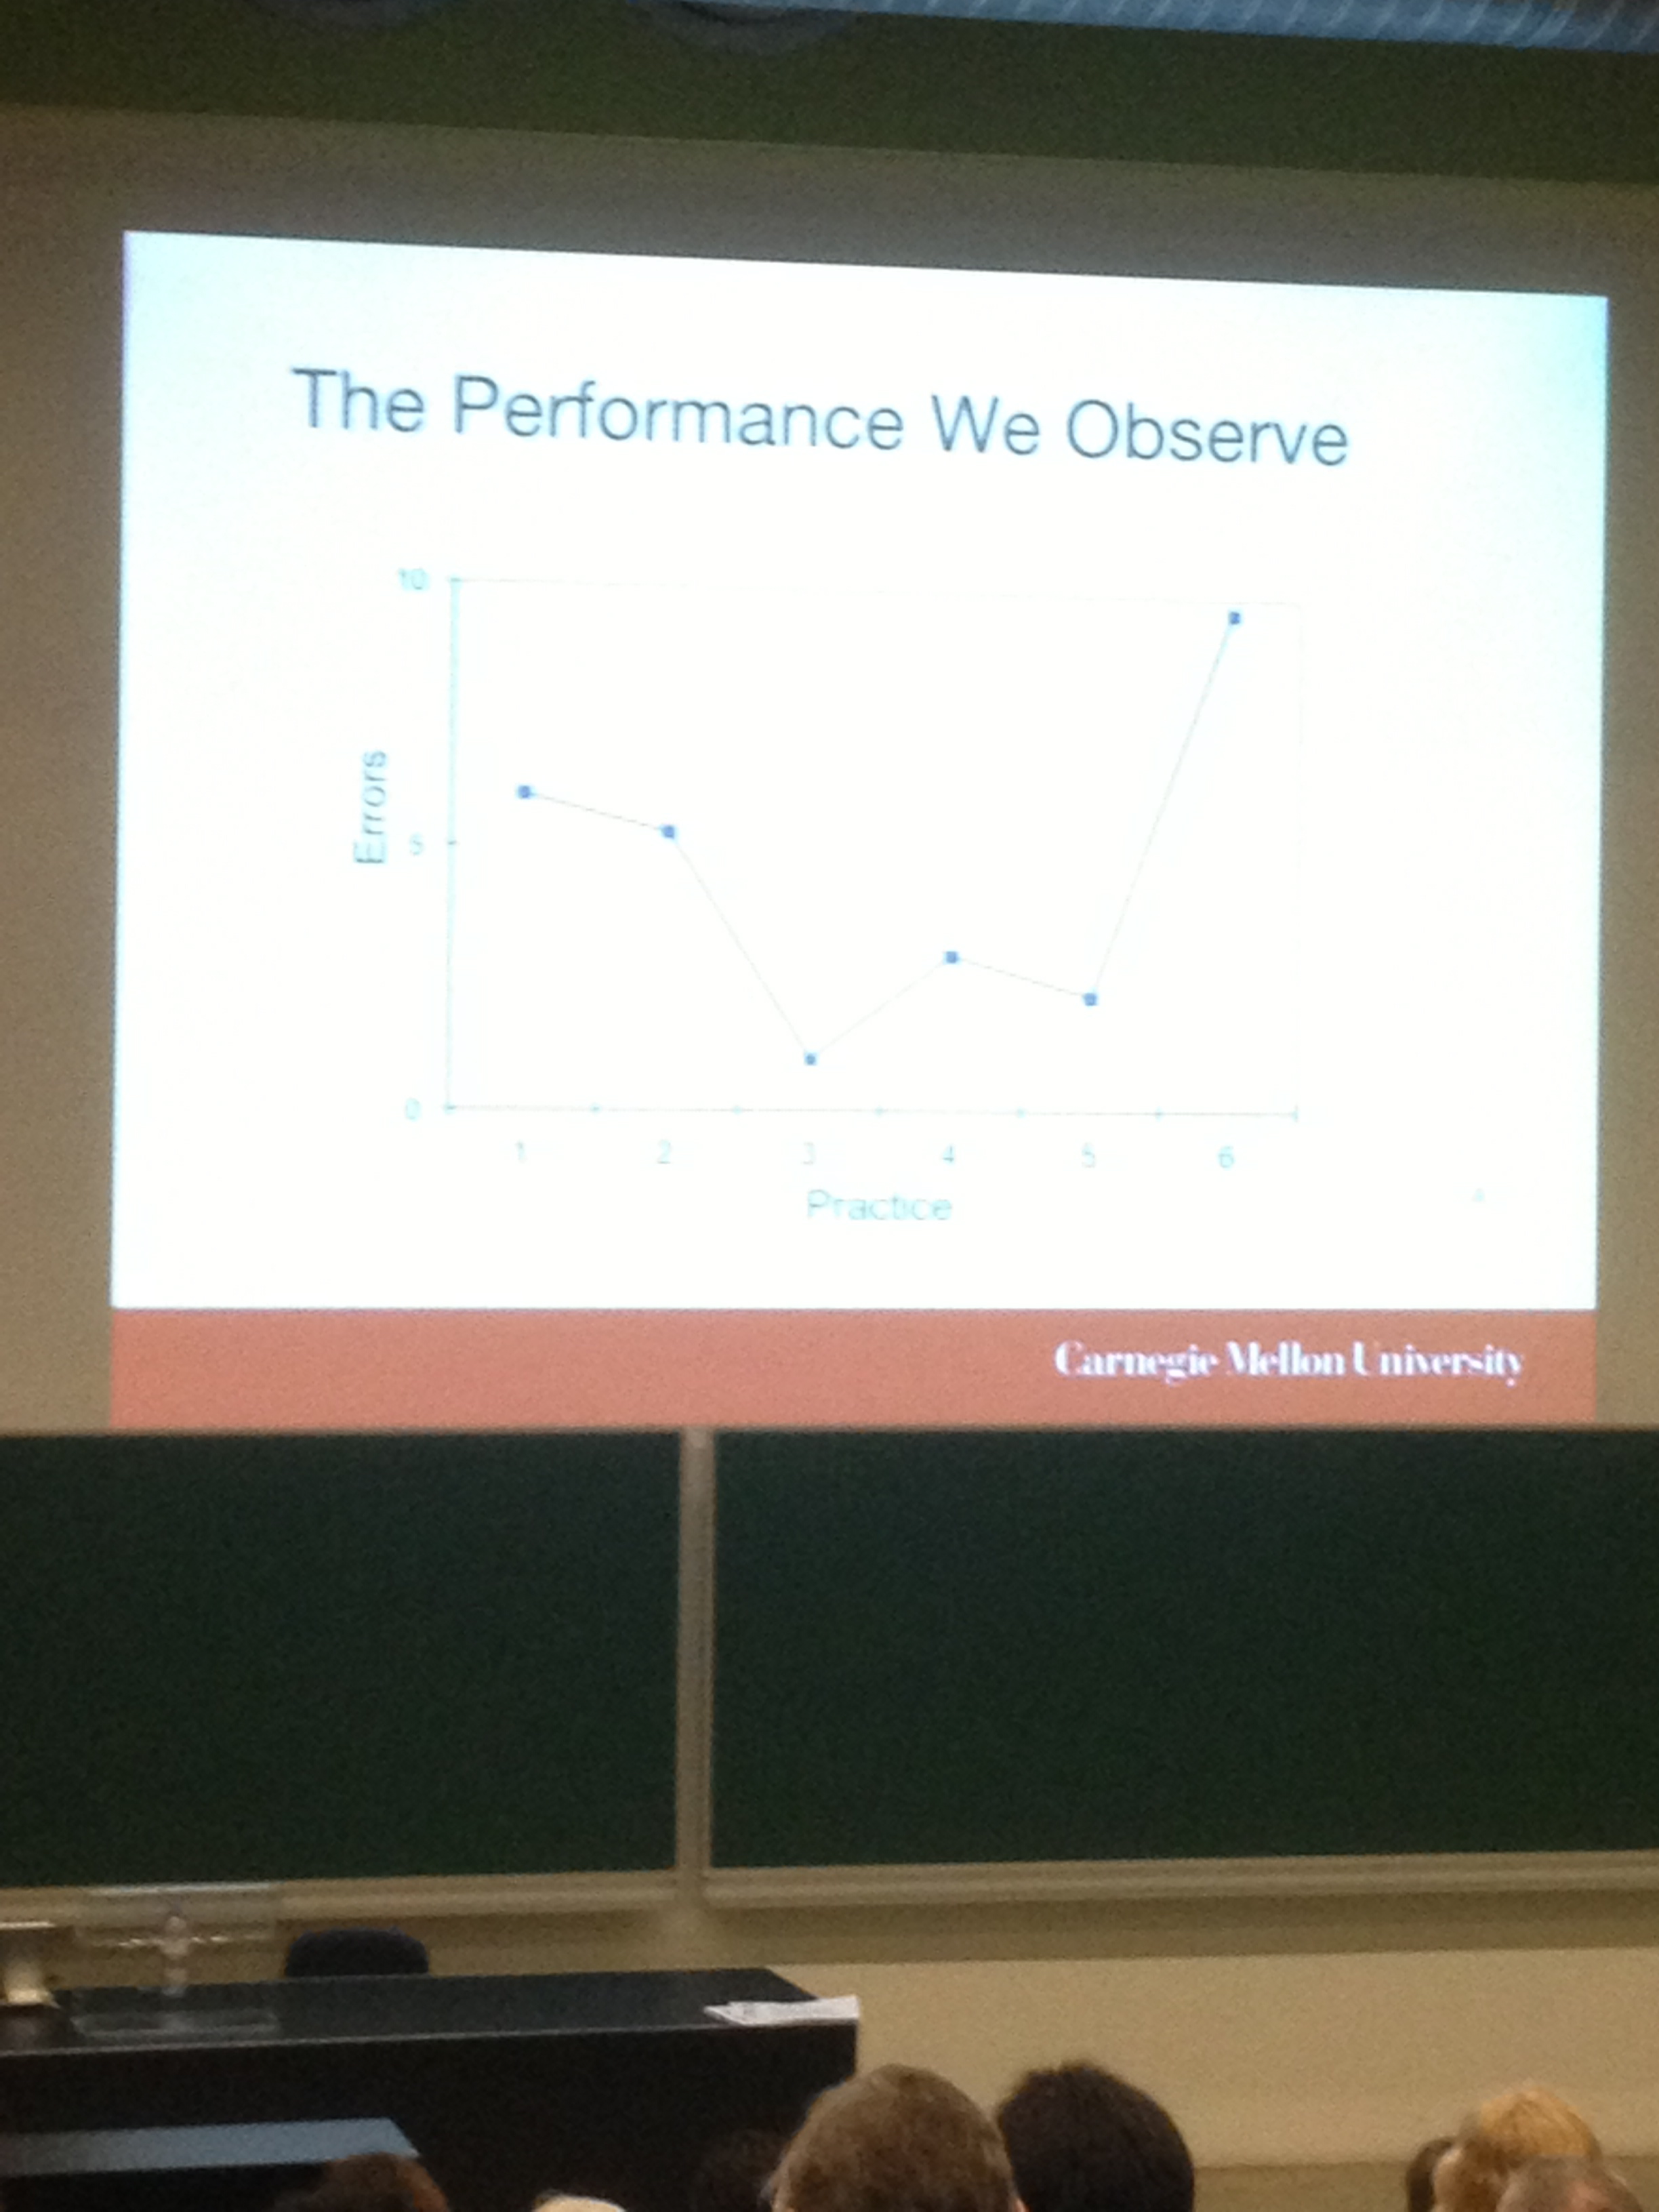
The lack of linearity is explained in that each problem requires sub skills and when the frequency of practice of these is taken into account a linear relationship becomes apparent.
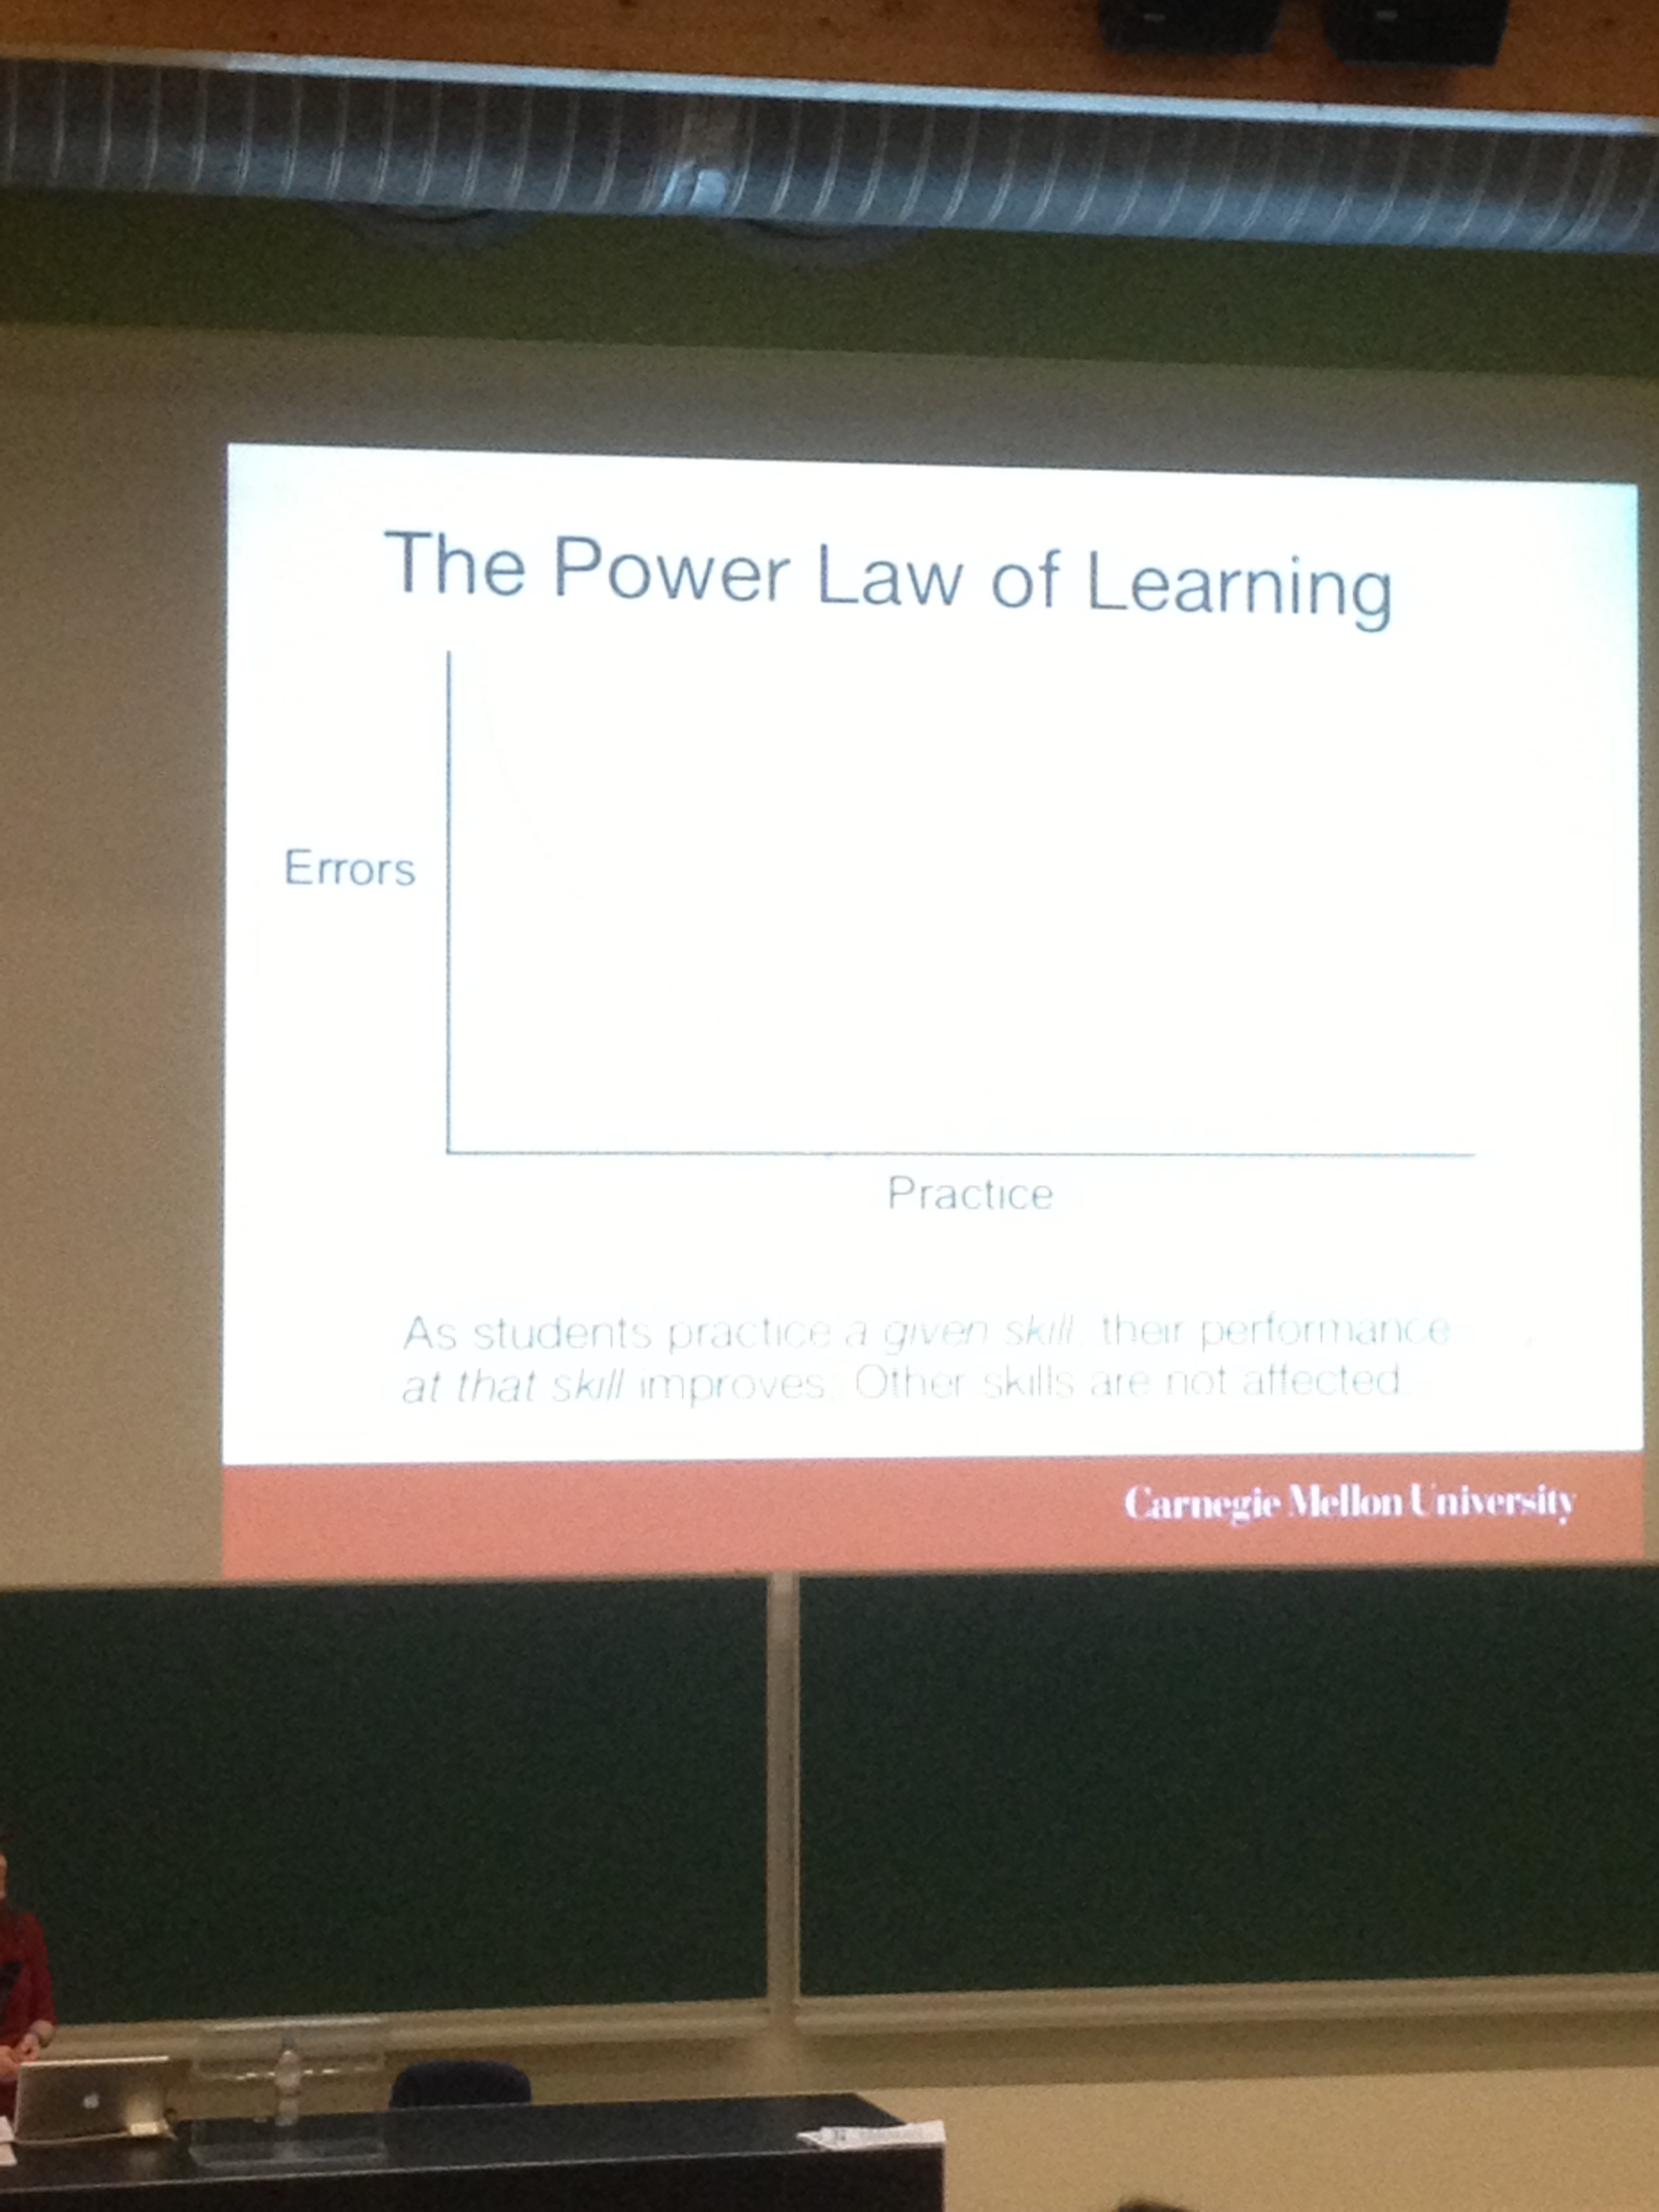
The analytics have helped us parse a domain into constituent skills. Thus teachers can track students learning and adapt instruction to meet students needs while students can monitor their own strengths to focus their practice where they most need it.
2. Built on solid course design
Instructional activities are effective to the degree that they
2.1 Align with the skills students need
2.2 Offer opportunities for repeated practice
2.3 Provide targeted and timely feedback
3. Meeting user needs
Instructors typically have access only to averages or distributions of student scores on graded activities
But these come too late. What they really need are up to date actionable insights and this is where analytics can help. They can even provide the actions eg suggestions for appropriate supportive materials / exercises.
Students typically only pay attention to the grade so again there exist opportunities to introduce up to date actionable insights.
The insight triggers mentioned were a little weak here and I’d be keen to here more about them. The actions might be suggestions as to which areas need more attention and where to go to achieve that.
Both Instructors and Students need ‘meaningful, actionable inferences from the data’ and Marsha suggests that to achieve this visualisations should be quick to comprehend, flexible enough to drill down to detail, customisable to meet individual needs.
So there’s the theory of it all. So what?
Well in this case Marsha is showcasing a system called ‘The Learning Dashboard’. This has been designed addressing the previous three key ingredients.
The data exhaust created by each student in the learning management system are sent to the learning dashboard, analysed and performance with actionalble insights aloing with suggested actions are provided as neat visualisations. Voila. Learning analytics in motion.
It’s great to see a mature system in production that’s not Purdue Course Signals!
The system has tackled a number of interoperability issues. As my colleague Sheila McNeil of Jisc CETIS has been known to say ‘interoperability never goes away’. It’s a subject Jisc, SURF and Educause have highlighted as key to the success of analytics and we fell we have a role to play here. We’re flagging a concern that as analytics gathers pace, valuable data could become locked in / given away to vendors and perhaps even sold back to the sector. I wander to what extent Marsha has considered this in investing so much in her Learning Dashboard system.
So Marsha, the acid test, ‘what’s the business case?’ What qualitative data do you have to wow us as to improvements in student experience, retention, cost savings, efficiency improvements, the sorts of Benefits we at Jisc identified in our Business Intelligence InfoKIt
Improved decision-making (anecdotal)
Better strategic planning (anecdotal)
Better risk management (anecdotal)
Competitive advantage (quantitative)
Income generation (quantitative)
Efficiency gains (quantitative) Y – efficiency of interventions for student and instructor. Only need 7 assessments rather than 20 to mark
students learning to learn – communicate to investors the worth of life long learning
Performance benchmarking (anecdotal and quantitative)
Student satisfaction (quantitative)
Student retention (quantitative)
League table ranking (quantitative)
Improved data quality (quantitative)
Little time for questions so I decided to attend the follow up discussion session on the Carnegie system presented by Marsha.
My questions for Marsha;
Q1. What are the triggers eg the Derby Dartboard from my own project portfolio
A. I didn’t ask this as someone else couched a similar question. In summary ‘Nothing as sophisticated as Derby’
Q2. Interoperability and vendor lock in (to what extent is there a risk that as with systems such as WebCT locked our content in, vendors will lock our data exhausts in selling the interpretations back to us and elsewhere as well as locking us in to a solution
Q3. Assumptions; Students that they are engaged AND data literate (those who are not engaged won’t action the insights analytics offers them, those lacking data literacy won’t comprehend the visualisations) and Instructors that they are good, their courses are good AND they are data literate (badly designed and delivered courses – and I recently undertook one of these – won’t benefit from analytics, instructors with weak data literacies won;t declare them and will struggle to comprehend the visualisations)
Q4. What are the benefits and qualitative data to back them up? Is the business case based on that opening statistic of 50 hours for 18% improvement or is there more?
Student retention (quantitative)
Yes it increases but also we see enhanced perseverance on gateway / stem courses opening up opportunities top succeed in later learning and allows the focus of human effort to be placed on authentic tasks such as collaborative learning and let the analytics do the heavy lift on actionable insight identification
Efficiency gains (quantitative)
Efficiency gains in terms of the interventions for the student and the time spent learning, but also the instructor and their time spent pursuing only the highly effective and labour efficient learning exercises and dropping those that are high labour and poorly effective. For example only needing 7 assessments rather than 20 to mark.
students learning to learn – communicate to investors the worth of this new way of designing learning and impact on life long learning skills and therefore repeat business for Universities
Questions from the audience
Q. What are the possibilities of capturing data exhaust outside of the VLE.
A. Mobile devices for lab work would be nice, voting systems in class.
Q. How does research into instructional design impact on practice
A. That’s the role of the support section Marsha heads up. Proactive co-design with end users and a multi disciplinary team. They don;t use students yet – this is an aspect we at Jisc promote as the student voice is a powerful one and the educational opportunities are significant
Q. What are the limits of analytics?
A. What are the limits of educational technology? Marsha has been wroking with faculty who are moving courses online and is concerned about loss of ‘soft skills’ in the process (eg discussion, modelling, etc). So she’s mentioning the move by instructors to put too much online and badly. Marsha postulates whether capturing this data would be helpful.