December 10 2013 and today I’m at a Learner analytics and Big data event in Senate House, University of London
http://cdelondon.wordpress.com/2013/11/07/in-focus-learner-analytics/
#CDEInFocus

Quite a few of the usual suspects here (to me anyway!) such as;
Adam Cooper who co-developed the JIsc CETIS Analytics Series concluding first quarter of 2013
Doug Clow of the OU and the Learning Analytics and Knowledge (LAK) Community
Annika Wolff & Zdenek Zdrahal, Knowledge Media Institute, Open University who project managed a Jisc initiative I oversaw using engagement analytics for student progression
Another initiative I’m aware of is represented by Michael Moore of Desire2Learn describing the analytics capability in their commercial products (they have a large scale long term field test underway in Canada)
And my old colleague Steve Warburton is our compere for the day. What a treat!
Some new stuff for me here too;
Dr Bart Rientes, Senior Lecturer, Department of Higher Education, University of Surrey
Pamela Wik-Grimm, Manager of Learner Outcomes, eCornell
Ernest Lyubchik, Selflab.com
Unfortunately my train was a touch late so I’m not able to blog the entire day….
Adam Cooper (CETIS)
Adam touched on the perils of data visualisations showing us some poor examples with a plea to delegates to raise the bar and not be drawn in. ALso significance and sample size, and that correlation is not necessarily the root of causation. So don’t ignore statistics in favour of pretty visualisations. Adam pressed home the end goal of analytics being actionable insight and that identifying the insight people want and can action is going to be key.
At Jisc my InfoNet colleagues have an entire InfoKit (October 2013) available on visualisation at
http://www.jiscinfonet.ac.uk/infokits/data-visualisation/
Here is Adams summary slide
Next up Pamela Wik-Grimm of eCornell
Using targeted data driven online surveys to improve course design
eCornell sell courses that are learner directed or with course team expert input and teaching assistant delivery. So quite niche.
The analytics begins with a visualisation of the frequency of student access of various course elements asking why do they repeat these (are they great or ambiguous for example). Essentially these patterns provide the actionable insight. The sample sizes underpinning the demonstrated visualisations are very small (17 students) but the inference drawn is applied to the 35K students taking the courses. Which seems a bit unusual. Maybe they have determined that 17 is as good as a thousand responses. One benefit of this approach is that individual students can be asked what inference can be drawn, rather than using analytics to predict.
The insights allow course redesign for optimisation. Nice to hear some learning analytics not based on engagement activity and early warning of drop out.
Bart Rientes Surrey University
Bart highlights that good teachers are doing analytics anyway and asks whether there is anything new going on. He believes that much learning goes on socially (outside the formal classroom) and introduces Social learning analytics requiring visualisation of ‘the invisible’. Social networks play an important role in learning and these can be visualised (with whom do students network and what is the impact on their learning). According to Erik Duval (LAK Community) a problem with leanring analytics is the lack of clarity as to what it is that should be measured.
In summary, the low hanging fruit are not the best – clicks on web pages / VLE data (as the OU will be discussing later) are crude. Social Analytics offers far more powerful insight into actual learning.
Next up George Mitchell, Selflab.com
Delivering the learning ecosystem
A contact agnostic adaptive learning and analytics system
A system to deliver a truly personalised learning experience. So providing appropriate materials to them at an appropriate time emulating a good teacher but remaining subject and content independent. Which all sounds a bit sci-fi.
Three components are identified;
1. Target Knowledge. A model showing linkages including pre-requisites, required competencies and navigation through elements to evidence these. This identifies where a student is coming from (prior knowledge) and where they need to go to (required competencies).
2. Intelligent Engine. To provide the individualised learning path measuring and predicting ability. The system determines pre-knowledge and provides a path that fills the gaps required to demonstrate the required competencies. Varying learning styles are also catered for in terms of content offered. So content is also profiled and effectiveness of that content is provided to the learning designers.
The system has been used as; 50K students, 75K course enrolments, 18 million questions developed and delivered, 317K practice and revision interactions, across 60 courses. So pretty impressive.
Key here are;
Personalised approach respecting student prior knowledge
Automated appropriate content generation and delivery
Analytics to feedback on content performance
Next up it’s Annika Wolf
Annika is presenting work Jisc funded and I oversaw based on student progression / retention, demographics and VLE clicks. Here’s their case study.
The OU has very large numbers of student so accuracy and timely prediction of likely student failure allows smarter targeting of OU resources to intervene. The work here is moved on, the underpinning models are drawing on prior student behaviours across multiple learning activities including assessments. They found that VLE data (interpreted as engagement) or assessment data alone weren’t as accurate predictors as when combined. They determined that the first assessment outcome (not submitted or less than 40%) was the most accurate predictoin of course failure. So this was targeted as the actionable insight. Mashing in demographic data with VLE gave reliable predictions.
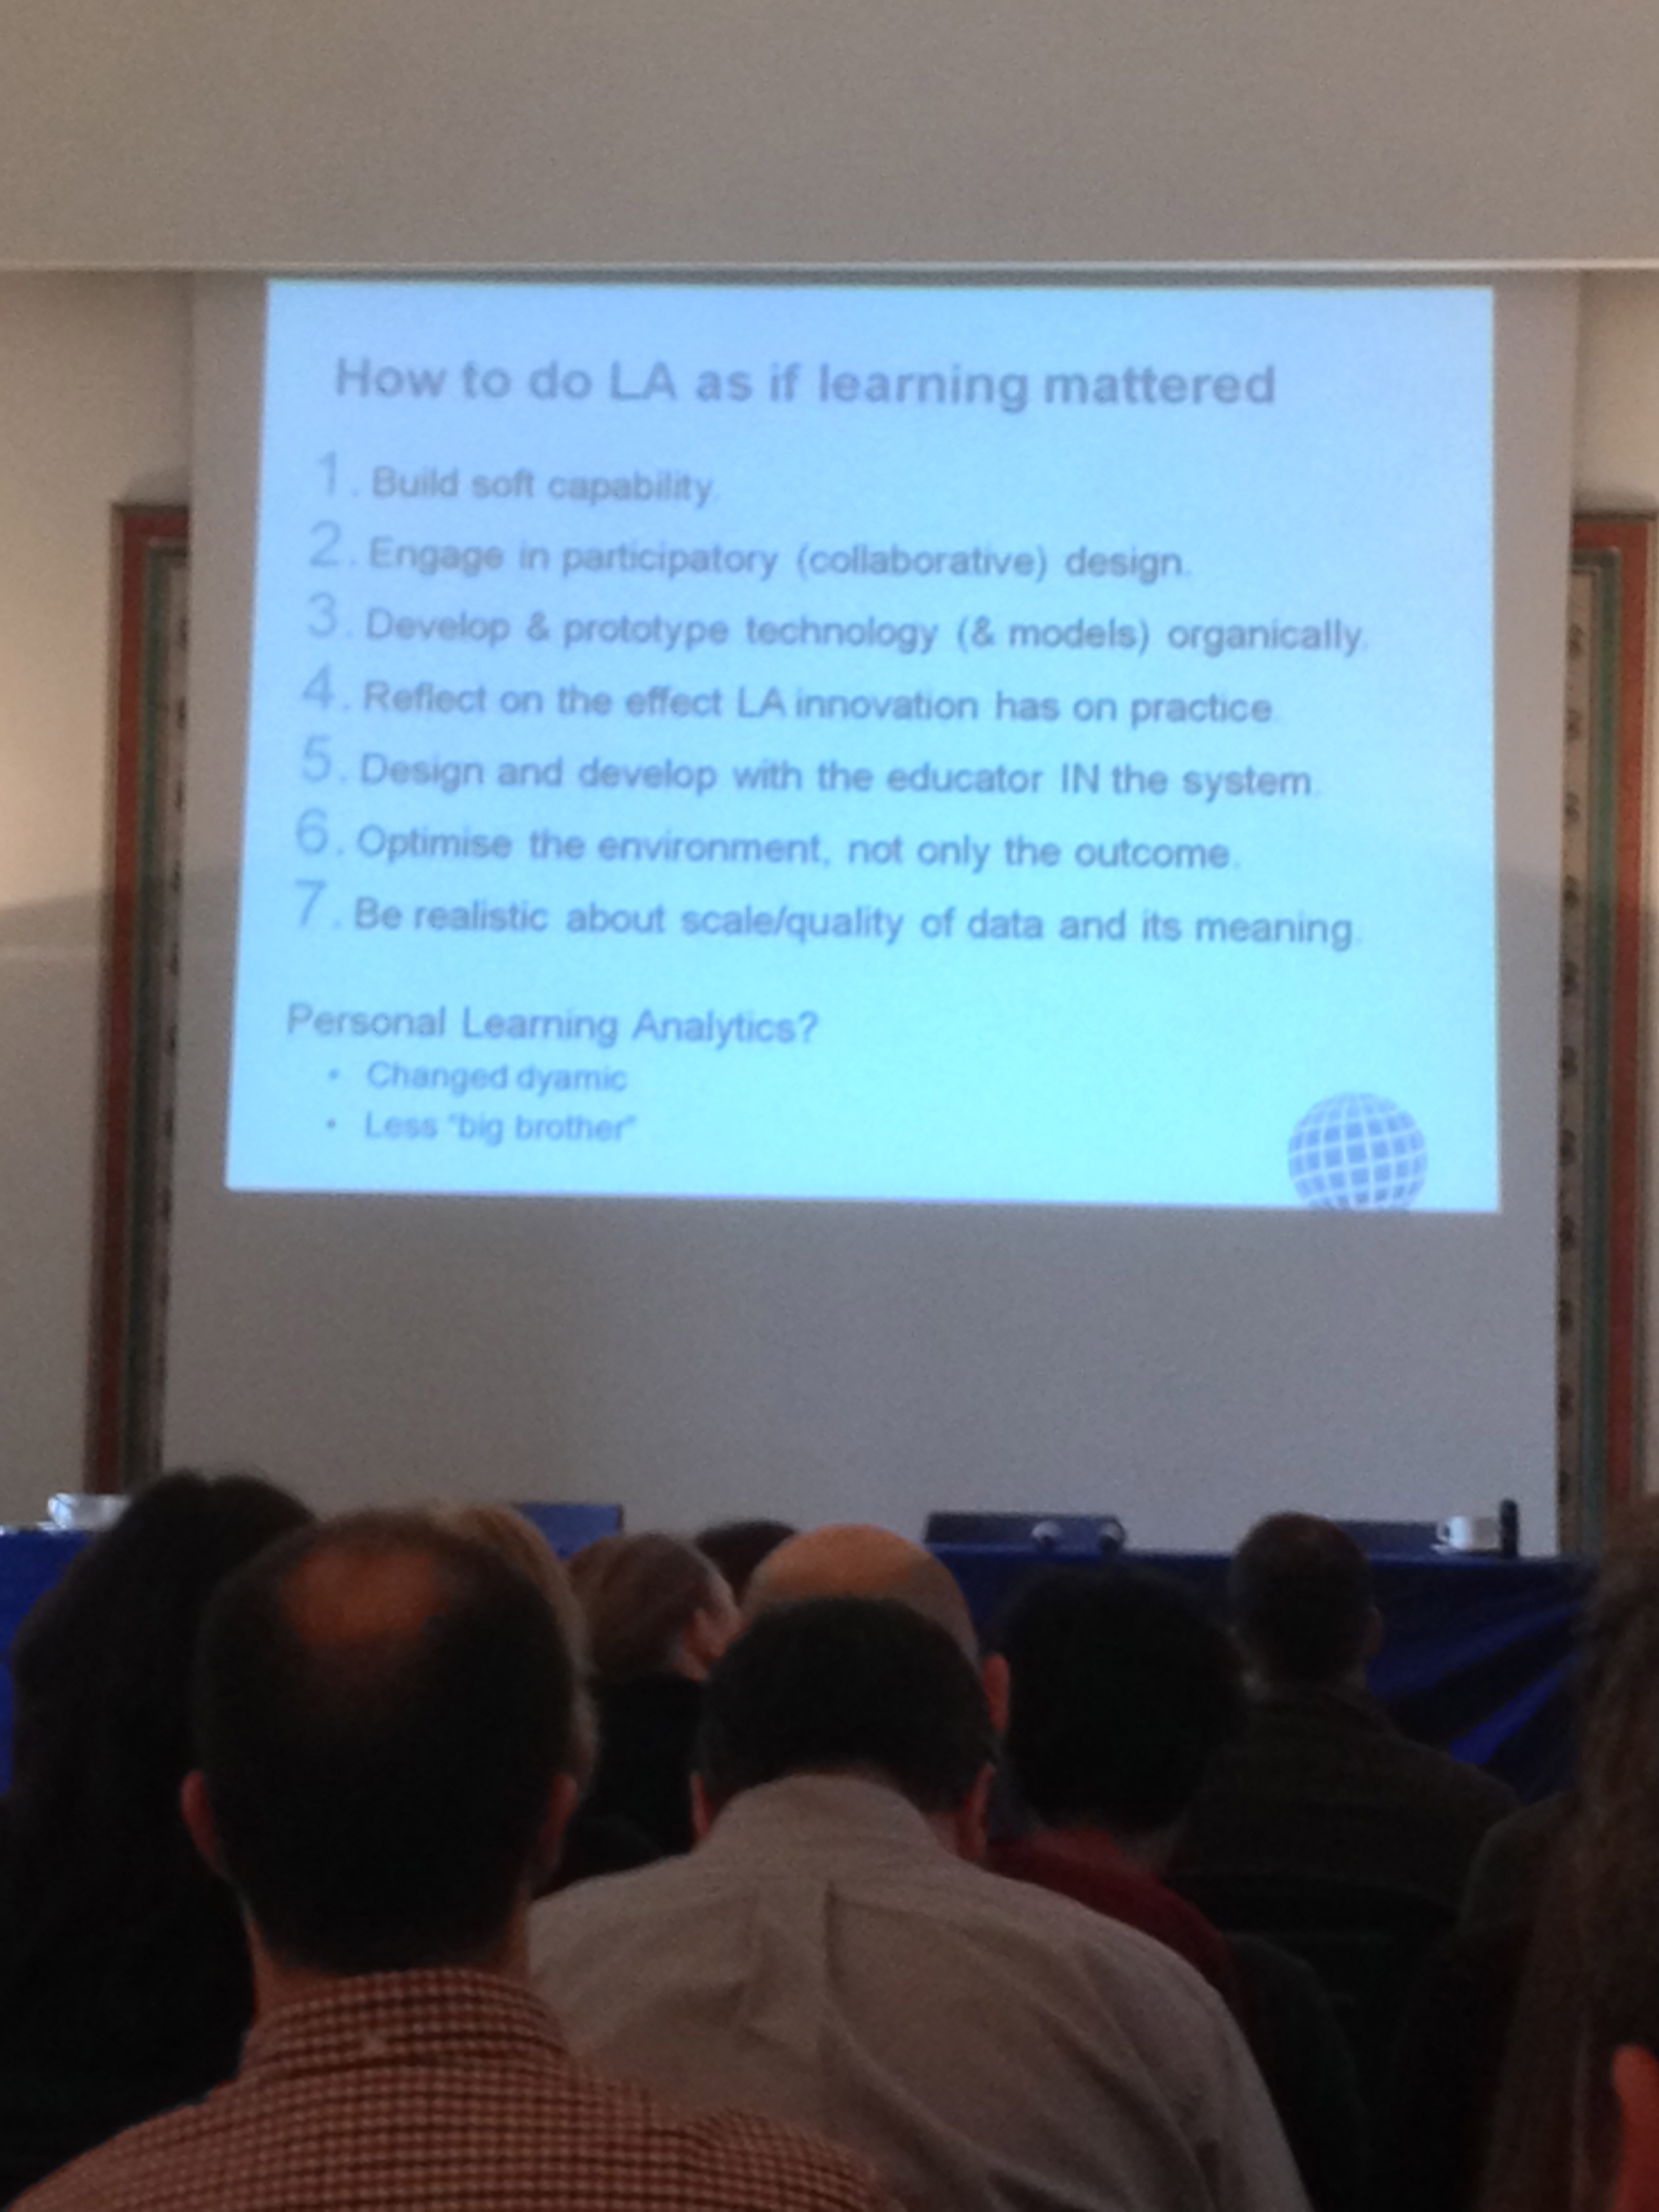
Next up it’s Doug Clow of the OU and the Learning Analytics and Knowledge community
Doug is into MOOCs and explains why analytics for MOOCs is hard. We know that people drop out of MOOCs a lot (93% from MIT) but the reasons for why are very complex. Hard and complex with large drop outs, that’ll be the MOOC then. Doug presented some fab graphs of MOOC completion rate. As ever he’s so organised and has posted his slides here, so do go look.
Doug has drawn a parallel with the marketing funnel;
Awareness
Interest
Desire
Purchase
and that this can be applied to higher education in terms of learning opportunities and the steep drop off in terms of participation toward achievement (hence a funnel). It’s in his slides. As are some notional completion rates (90% for an elite university right down to <15% for MOOCs and noting that 12 MOOCs might be required to be equivalent).
Last one today is from IBM and the University of London on learning analytics based on augmented Moodle VLE data
Richard Maccabee (Director of UoL ICT) and Uri Barran (Predictive analytics solution architect)
Quite a complex approach this one. Seems to be attempting to cover the entire student lifecycle from pre-admission to alumni. Today they are focusing on
1. Identification of a first term high risk of drop out model
2. A decision management process
3. then on to the delivery of the insight so someone can take action
This is a real ‘under the bonnet’ look at underlying data, models and decision trees. It’s a yomp around a toolset for a practicing analyst. Certainly not the sort of tool you’d ever offer to a teacher or a manager. The outputs are graphs showing student population performance prediciton based on subjects, a list of high risk students, a view into the different aspects of their course performance(behaviours perhaps) along with a set of suggested actions.
A nice day and put on for free. My thanks to presenters and organisers and congratulations to Steve Warburton on his recent elevation to Professorship.
Pingback: My Analytics Shortcuts « Myles Danson
Pingback: Analytical engines | Robs Work Blog
Thanks for the overview Myles. It was good to see you there on what was a busy and excellent day. The range of talks really gave a sense of what is a growing domain – one that is quite diverse in the approaches that are being taken to understanding what are the critical questions that analytics can answer in differing educational contexts. Look forward to catching up with you again soon. Steve