As I crossed the street from Convention Centre to join a meeting with Eden Dahlstrom (EDUCAUSE Director of Research Data, Research and Analytics) and Hank Childers (the Higher Education Data Warehouse) I came across an adult alligator in the bushes. Turned out to be plastic. No one was around to observe the dumb Brit running of the staircase!

Session 1 Student success is everyones business
A. Pam University of South Carolina ‘beyond the classroom matters’
Issues; accountability, transparency, increasing demand
Support Provision; ‘student affairs and academic support’ focuses on the whole person; intellectual, physical, emotional, social, vocational, spiritual.
Success Indicators; Learning, retention, graduation and employment
Aim to see the entire undergraduate experience in data. Essentially tracking student interactions with institutional systems beyond the academic program, something in the UK I know as Engagement Analytics. The problem faced is that student information systems do note record non-academic engagement and this is the subject of ‘beyond the classroom matters’.
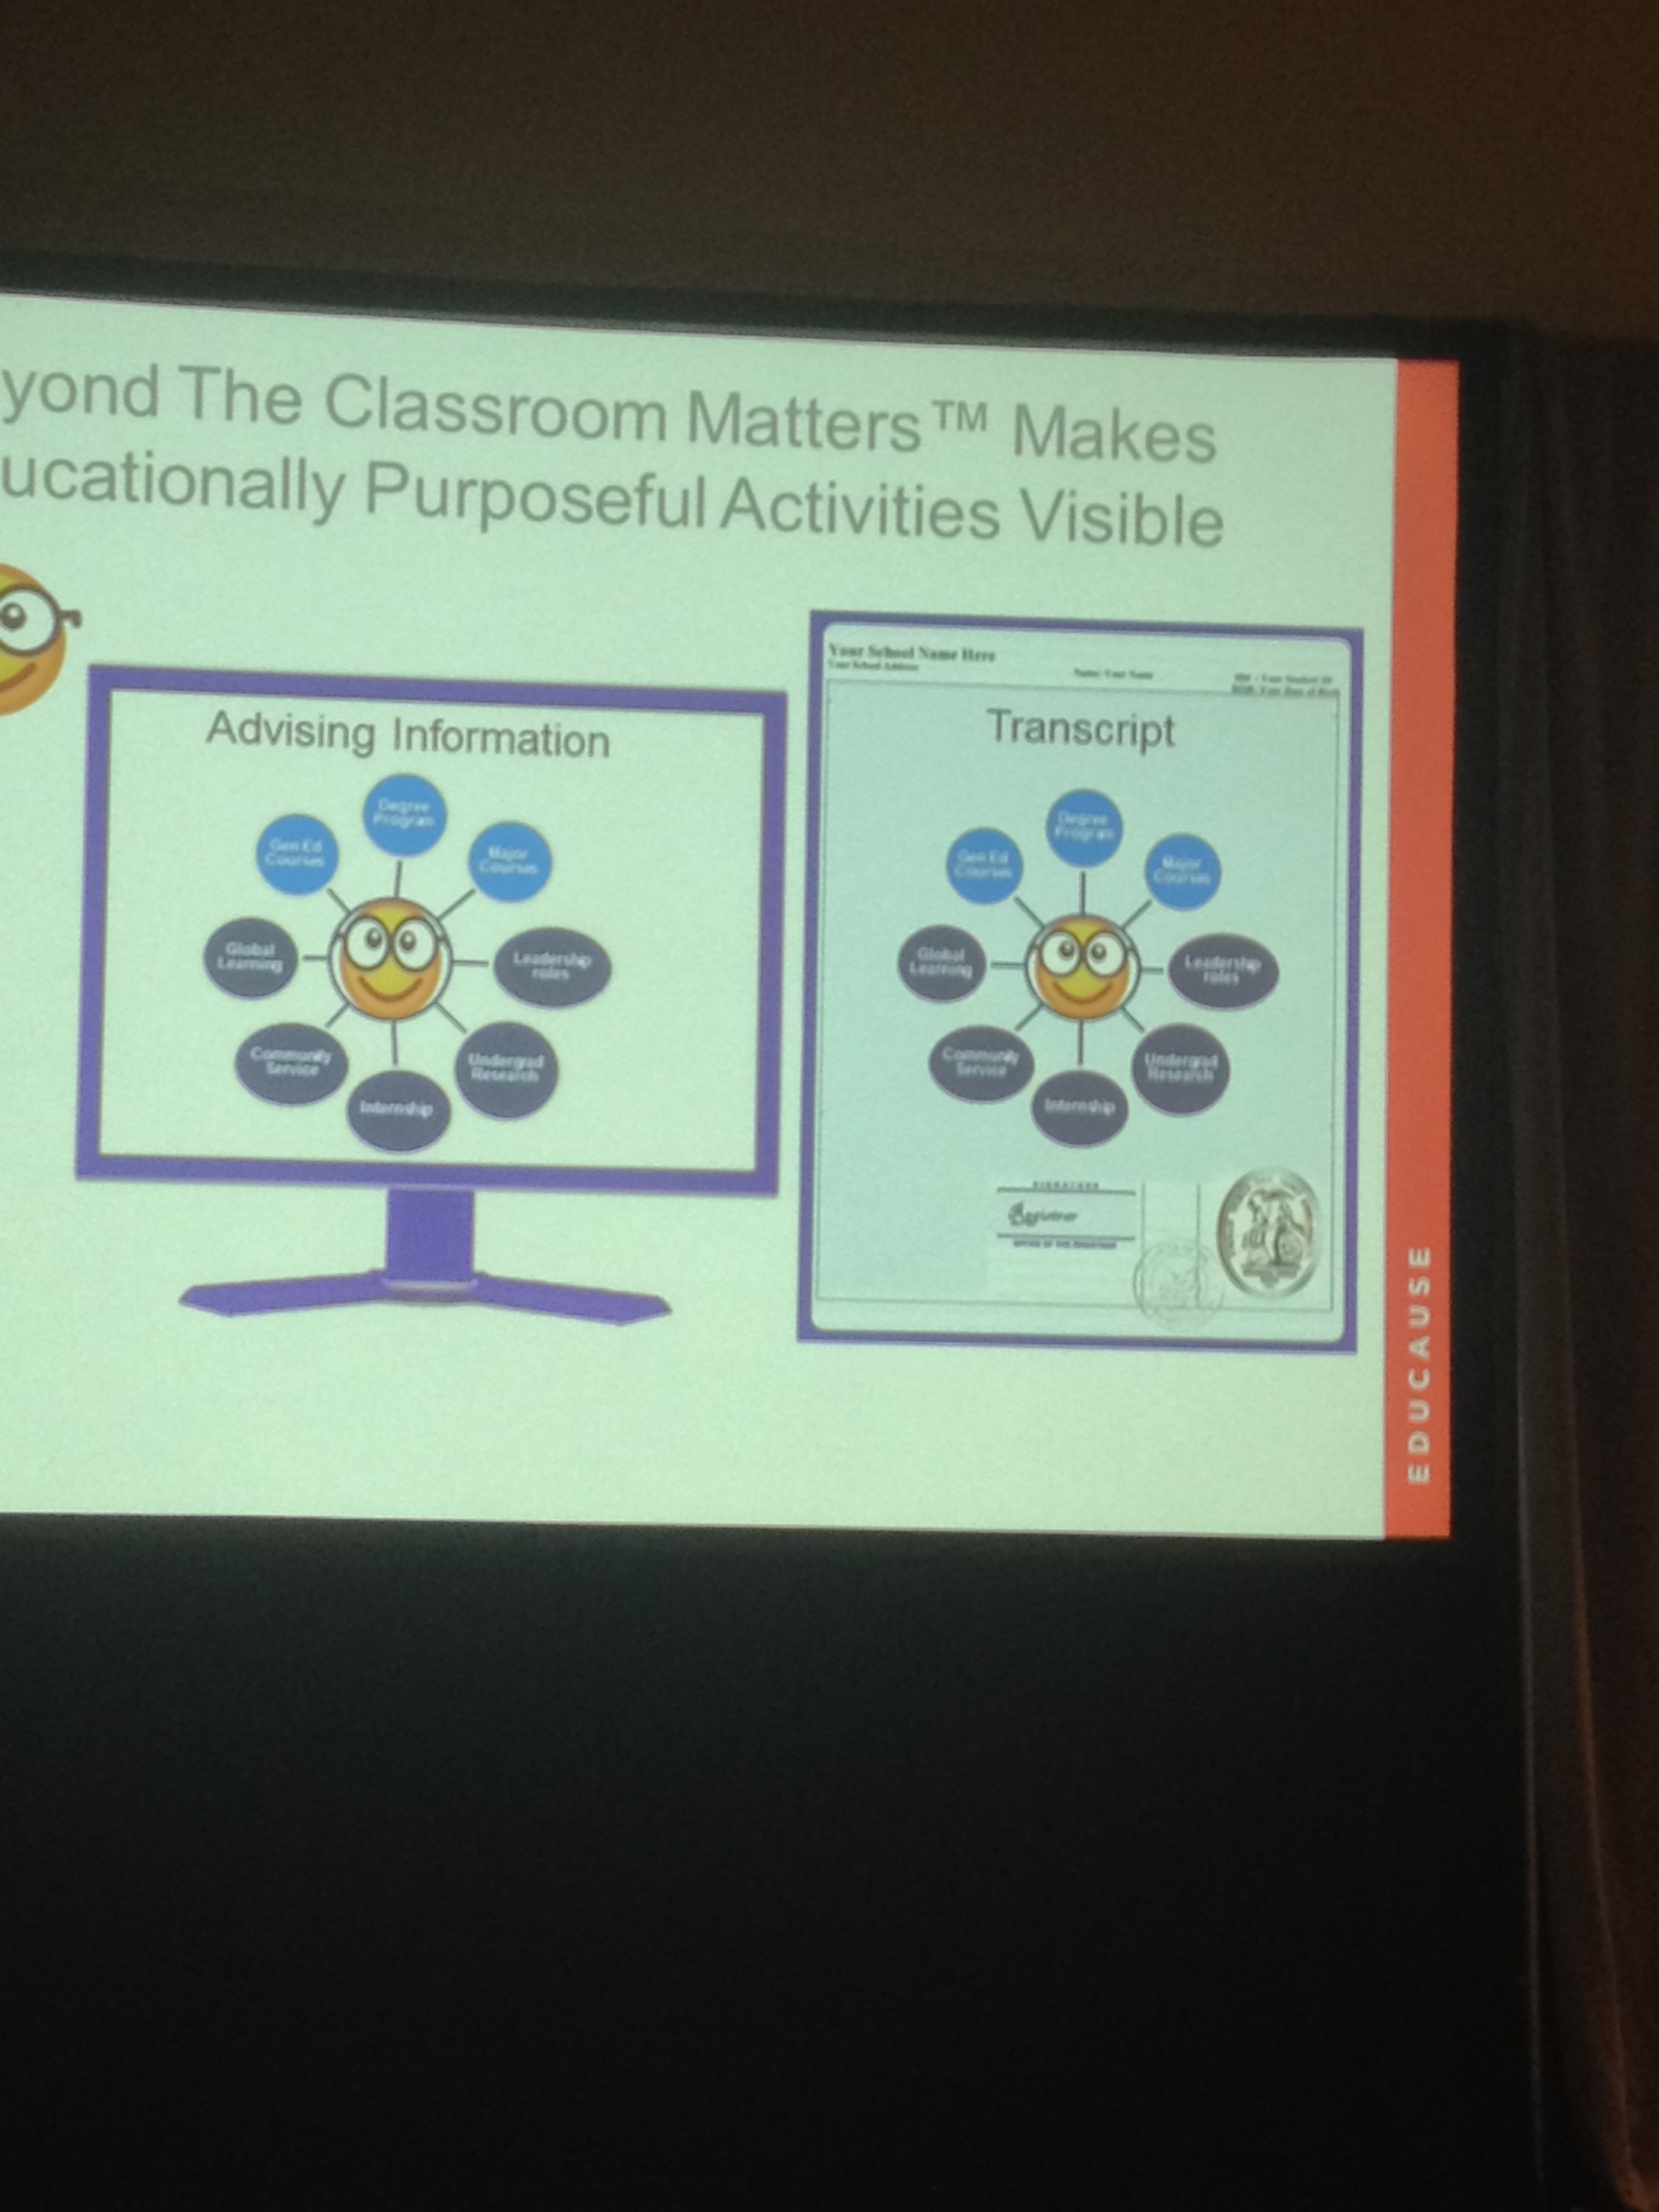
The vision here is that student analytics helps advise students of academic courses and non-academic activities to help enhance their chances of achieving well on those success factors. I don’t think this is a done deal but we’re hearing about vision and progress toward it.
KEY LEARNING POINTS; Seek friends and funding – IT have the key to delivering, but are bogged in other priorities. Success is about collaboration across disparate functions led by a champion and a shared vision.
B. Carleton College and Grinnell College qualitative and quantitative research to support student engagement in the support services
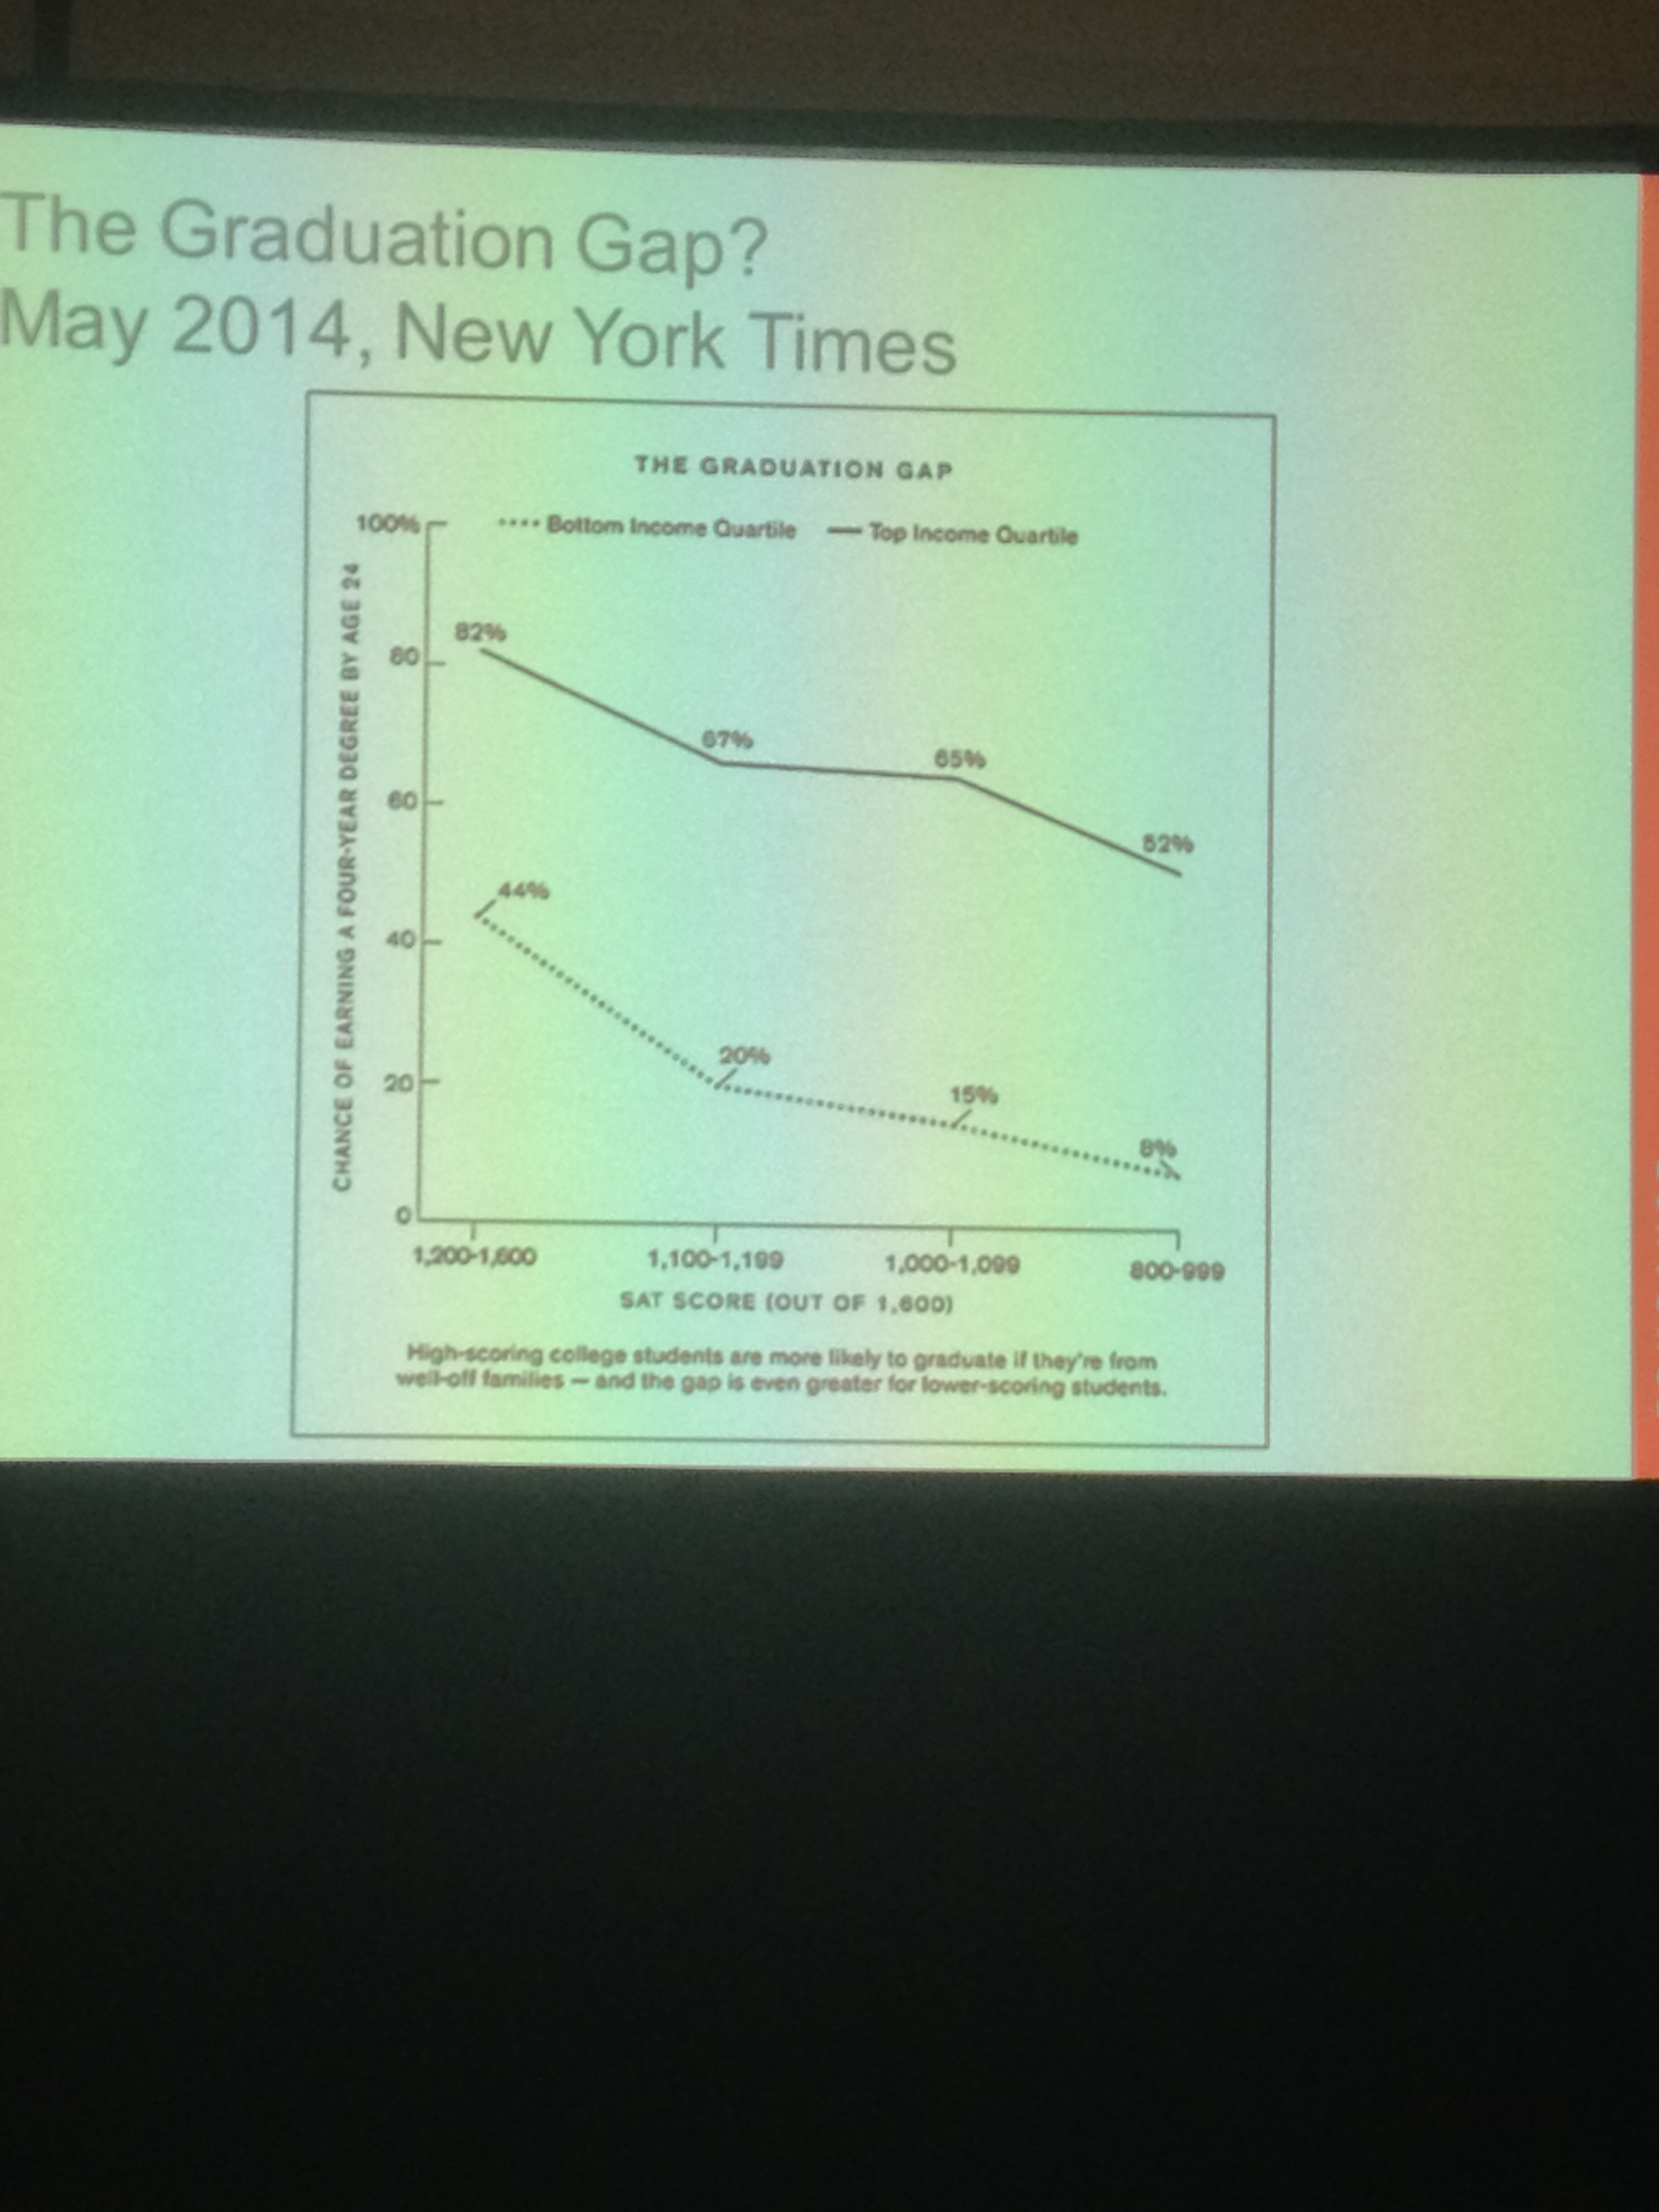
A presentation of longitudinal (5 year) studies into the role of student services in retention and progression. 86-95% six(!) year graduation rates. Six is interesting and perhaps reflects the student profile. Looking at 4 year and based on income these are national figures;
The analysis gave actionable insights to improve the colleges performance against the average. The action brought poor in line with affluent at 4 year point. Students who drop out cost the institution $60K per year.
The major factor affecting student dropout was successful development of relationships. The college proposed to learn from other sectors and propose that the clinician / patient relationship is a helpful source. Who saw the student, what measure did they prescribe, did the student act on the advice, what was the outcome. Tracking and sharing these is the aim. The Co-Tutor system in the Uk does similar things to this.
KEY LEARNING; mine the data and create new ways to visualise to the right people at the right time. Real time systems. Look beyond the tips of your skis – predictive modelling to identify the soon to be at risk form the past. Work together. Look to emulate the medicine / patient model using diagnostic testing to provide insights into learning at an individual level.
Session 2 Analytics that inform: the university challenge
An expert led panel session sponsored by Realize IT.
Analytics – what does sit mean? Taken from BI – can we use the same type of approach to mine student data for insight. Faculty performance, student performance and improving student outcomes. Now using real time analytics to predict. Analogy again is medicine diagnosing and being empirical to diagnose weaknesses and offering a series of interventions to address those. There are powerful ‘code halos’ that can be wrapped around educators, students, institution to yield information and through algorithms drive a nexus of learning between the student and the institution. My, what a mouthful! Transactional data into insight, insight into interventions. We can accelerate students’ learning based on their competencies, prior knowledge and aspirations. We are finding ways to enhance learning for students who are perhaps not as driven as those who used to be successful. They are able to enjoy education more, finding it exciting, thrilling. The example was hiding the pill in the peanut butter – provide the less palatable materials within those a student finds enjoyable. So different ways of designing content. Individual curriculum design. Multi-modal ways of learning are the norm for the student body. The education industry needs to look at how new models of different paths to arrive at the same outcome can be embraced. Be careful what you wish for; Look at http://musicthatmakesyoudumb.virgil.gr – correlation of play lists to mean SAT scores – analytics can be made to prove anything but meaningful correlation isn’t always present!
KEY LEARNING POINTS; We are at the early stages of analytics. We are data rich and information poor. A code halo – how you mash the institution data with other – the ethics are important – hurrah – first time ethics has been mentioned in these sessions. Sequencing courses and curriculum should come soon. Diagnostic testing in medicine is expected, the notion needs to be embedded in education! An aggregated federated repository of related information is one vision of what needs to happen. Educational models need to be multi modal to suit individual learners and the needs of these learners should be profiled by analytics. Analytics will help inform how faculty spend their time and efforts with students. Deconstructing faculty roles; some will develop content, some to deliver, some to assess, some to deal with other student holistic needs. Analytics will change the fundamental role of faculty. Analytics will provide quantitative measures for the value add of Higher Education. They will obviate the need of end of module surveys and pave the way to performance related pay(!) for those faculty having the best instruction to their students (even if they may not be popular). A curriculum designer needs a different set of dashboards to a teacher.