Changing the Learning Landscape and the LFHE April 2013

I should say upfront that these are live blogs – as such there may be the odd typo!

I’m involved as a consultant in this HEFCE funded programme organised by LFHE and with other partners including my employer Jisc. It has a twitter tag #CLL1213

Today I’m at the Oxford Said Business School meeting other consultants and associtions to share tips and tricks as well as determine the way forward for any future activities.

Said Business School

Or as the agenda describes it:

• To enable colleagues working on different strands of CLL to meet one another and
share perspectives
• To identify potential ways of continuing to work together to support the sector in
2013 – 2014
• To incorporate new policy and technological developments as they emerge during the course of a dynamic set of programme activities

We started off with a nice ice breaker by Professor Stephen Gomez, Academic Lead – Online Learning, Higher Education Academy and Jessica Poettcker, Quality and Student Engagement Consultant (Technology Enhanced Learning), National Union of Students

Here groups were invited to label a Flikr image with CLL ‘beneficiaries’, in terms of where they are and where we’d like to see them move to. All good fun and something I may use myself.

Here’s an example

mudhuts

Here’s a very quick explanation of where we placed people in the village

Integration into the student environment
Central services reaching into the huts as different sections within the univertsity
The estate and its role
Learning styles and how accommodation can be utilised
Employers and alumni being on the ground
The academics (on the tree of knowledge)
Support roles who might be in the hut, at the heart of things and highly visible, or on stony ground and having little impact or in the dark yet doing good things

Next up are my colleagues Tish Roberts and Lawrie Phipps who will explore with the group

‘Potential for Year 2: what we may achieve together’

Tish hopes to identify what the achievements have been as group work and Lawrie has opened a ‘Padlet‘ which we used to capture some of these as PDF

Next up Lawrie challenges us – ‘if we were to do this again, which three things we did really well together should we do in the future?’ as individual consultants and as organisations. Here are those my table identified.

1. Defining a convincing vision for a technology enhanced future for educational experiences as each organisation comes at the area from different directions.

2. Synthesis from the case studies and stories from year 1 to help others attain the benefits themselves. Engagement from senior leaders and how to engage the relevant stakeholders in transformative change. So realising the benefits more widely.

3. A suite of vehicles to help people achieve similar change such as webinars, practitioner events etc etc

Captured as a PDF

Next up it’s Maren Deepwell, Chief Executive, Association of Learning Technology Incorporating change into a fast-moving programme

Maren started off with this slide of key questions

ALT Key Questions

The group highlighted the following additional key issues

1. learning analytics as a further opportunity (and new readers of this blog will find lots on that topic here including a write up of last weeks Learning Analytics and Knowledge Conference (Mark va Harmelen)

2. re-engineering the lecture and new pedagogical approaches underpinned by technologies (and not) (Patsy Cullen)

3. New types of learners (rather than technologies, look to the learners themselves and their needs) (Paul Bailey)

Next up Maren sets up some group work ‘how we can be responsive as a programme’

ALT Slide 2

Here were the thoughts my group came up with;
1. Preparation to bid and building capacity to engage
2. Incubation of ideas and pre-incubation for the non-involved (includes refining what is desirable to achieve and why in the context of each institution)
3. Streaming into strands or identifying other interventions (could be introductions and shared work areas outside of the CLL)
4. Address the cyclical nature of CLL in terms of outputs becoming available and new markets for them (includes individual and organisational capability)
5. The notion of ‘CLL Alumni’ acting in some capacity as ‘Mentors’ to new projects

The final activity from Maren is to learn from what works and link into what’s happening

ALT 3

So the group is to identify ideas of approaches that are working and any key events / networks / individuals that CLL might develop links with.

We highlighted the following:

1. Tapping into National Teaching Fellows as they are experts, keen and under utilised
2. Librarian and information specialists in particular for their teaching potential in information and digital literacies
3. Sheila Mc Neil and the Learning Analytics Series
4. The flipped classroom
5. Design for Learning / techniques for curriculum design and delivery

Maren wil collate these and if she blogs I’ll add the link.

All in all a busy and informative day with some nice group work. Nice to meet fellow CLL Consultants and also the LFHE team behind the programme.

Day 3 AM; Learning Analytics and Knowledge Conference April 2013

I’m now attending a panel session aiming to highlight themes emerging from the conference. But first up a pitch or two. There’s an international series of learning analytics events 1 – 5 July starting at Stamford then following the sun. Sheila and Martin (Jisc CETIS) and I are pondering whether we could step up and run something in parallel, perhaps not that long though. It could be a contribution to some grass roots nurturing for the Learning Analytics Community in the UK if (and I think it’s a big if) we can find the right people. I’ve suggested we go through Planners and ask them to put the word out to other colleagues they know are involved in data. AUA would be another route. Jisc InfoNet and I are starting some engagement with professional associations representative of UK staff groups / job roles and I’ll include this to see what response it gets.

We learned last night that LAK14 will be hosted by Indianapolis so presumably Nascars’ will be in abundance but not Jisc programme managers (I’m very fortunate to be here in Leuven, it’s getting tougher to pass a business case for overseas locations). Dan Suthers (who pulled me into the panel yesterday) pitched this even more exotic event too;

Hawaii Event

Out of the blocks early this morning and we have the first paradigm shift of the conference. This is regarding big data and reinventing the classroom. NSF is reporting a healthy increase in their budget with cyber learning and online education being highlighted as key investment areas.

NSF Budget Uplift

I threw down my own challenge yesterday on the panel session I was a member of. That was based around the need to coordinate an innovation –—> embedding cycle. I noted that the loop wasn’t closed yet and as such the likelihood of the research beginning to change daily practice is far from optimal. Here’s a summary of my points;
Focus on the benefits (which and to whom and how). Co Design and partnerships (include vendors, stakeholder bodies). Business cases for investment. Address policy and governance. Address organisational AND individual readiness issues. Keep up the grass routes innovation.

This seemed to go down well, though I don’t see the capacity here to coordinate. I had a chat last night with Doug Clowes and Tribal. I was impressed that Tribal have an innovation arm working to gather needs and expertise from their academic clients in order to do the heavy lift for them. So in that sense a shared service across academic Tribal clients undertaking the requirements / stakeholder needs / horizon scanning and taking academic theory and developments from incubation to reliable service. That’s the sort of thing I was pitching for.

Here are some challenges from the speaker

Challenges

Next up Paolo Bilkstein offers his perspectives on learning analytics research.

Perpectives

He notes that we teach what we can measure. If we don’t measure what we care about, it will never be taught. The intention here is to avoid optimising what we already teach. Rather we should design new ways to measure things and teach those.
Next observation is a bias toward cheap data. That we should work on both data analysis but also on new data collection techniques. The latter may not be such a quick win but is essential work.
We need to push the system to embrace multimodality and the social aspects of learning. It’s easy to collect data about student activity (that cheap data) but there are other interactions we shouldn’t ignore that are harder to capture. Acknowledging the social aspects requires changing the ways we collect and analyse data. This is evident in the Derby Dartboard I mentioned in an earlier post from the conference.
Next thought is that there are big political and economic interests at play but we need to keep an eye on the end game. Analytics might lead us to a future scenario that while educationally efficient and profitable, is not desirable. The notion of children sitting in isolation pressing buttons as the analytics system introduces course content based on learning performance is an extreme one.
And the last point? Disruption. The data analysts here must step outside their comfort zones and play the role of disruptor.

Our final speaker is Elisa Wise from Simon Fraser in Vancouver. I chatted with Elisa last night. She’s very Twitter / Social analytics research active. She asks ‘Do we really need another dashboard?’ which raised a few laughs.
Elisa suggests that instead of large overarching dashboards (or a large all encompassing analytics system) we need a series of smaller ones fit to task. So smaller projects gives us the agility we need to achieve quality. Elisa is heavily into discourse analytics, the analysis of communication. I blogged on this area yesterday but didn’t see Elissa speak. She suggests that consequential validity is important, what implications and assumptions are embedded in the systems and how they will effect the way people teach. That the analytics will affect the pedagogy so diversity could be lost and shouldn’t be!
Keeping the people at the centre shouldn’t be substituted for algorithms and data. The conference has focused far more on the latter two. Data to empower people is a good thing (action based on sound recommendations) but also maintain their ability to add the human angle; creativity etc.
The standards and methods shouldn’t be overlooked. Tough to argue against that!

The panel have asked the audience ‘what blew your mind’ at the conference.
Clearly I’m in a room full of academics as neither panel of audience stuck to the question. Here’s one. The extent to which many talks were grounded in learning theory was seen as a wow factor in tandem with the concept of the imaginary learner.
Garbage in / garbage out is as valid as it ever were.

Nice I think if this conference had a track on applied research to target the multi disciplinary teams we see required to tackle widely applicable educational problems in addition to the niche research.

Linda Baer notes the importance of LAK pure research to keep ahead of the demands from politicians and policy makers demands for efficiencies and effectiveness (but by big data which seemed a little unnecessary). The panel felt that being at the bleeding edge is not what academia is good at. Huh?! If not the researchers then who???! Good that another panel member noted the need for the community to be more proactive rather than reactive to these sorts of demands and opportunities to address them via Learning Analytics.

We’re into the penultimate session of the conference and it’s Zac talking about correspondance between student behaviour states and ‘affect’ states and their end of year grade performance. If I’m more engaged in the school year will I get a higher grade? If I’m more bored during the year will I have a higher test score?

opening slide

Note ‘Affect’ is on the right of the slide; engagement, boredom, confusion, frustration, off task, gaming. So in terms of the actionable insight, if I’m bored the system might offer a particular activity to address this.

The reasons to measure ‘Affect’ correlation with state tests include teaching to the test. Once again we hear that ‘we teach what we can measure’. If affect has a strong correlation we should teach to include affect.

Here’s the methodology

methodology

Students were coded with affect labels (see earlier blog yesterday afternoon for more on this technique). 3075 observations were made of 229 students along the lines of

affect labelling

Kappa values are king here at LAK 13. Here are some of those;

Insert ImageKapp

The goal was to correlate affect with state test score. The results (original is student attempt, scaffold is attempt after intervention.

Results

Negative means poor correlation, positive the opposite. So the table shows all manner of things one wouldn’t have predicted without the analysis. Here’s a summary of the actionable insights form the analytics;

Conslusions

So does it pass the ‘So What’ test? Not really, because there was no description of actions taken. Clever stuff though.

Suffered a technical fail at this point so the blogging had to stop.

In summary We’ve heard about Visualisation to support awareness and reflection, sequence analytics, design brieifngs, multi disciplinarity, predictive analytics, MOOCs (I ducked those sessions), communication and collaboration, strategies, challenges of scale up, ethics and data, discourse analytics (I quite liked these), assessment analytics, recent and future trends (my panel), behaviour analytics and reflective plenaries. That was just during the day programme. The evening sessions ran through until late and offered the space and (in the case of the SURF dinner) the framework for further conversations. My thanks to the city of Leuven with it’s stunning educational architecture (dating back to the 1500s), our local host Erik Duval, the LAK organising panel, the talented speakers and participants.

Day 2 Early PM; Learning Analytics and Knowledge Conference April 2013

Apologies for the lack of blogs this morning. I had to work up a session for a panel this afternoon and join a teleconference for the day job. Here’s a photo of the Leuven town hall I took last night though.

Leuven Town Hall

Issues, Challenges, and Lessons Learned When Scaling up a Learning Analytics Intervention. Steven Lonn, Stephen Aguilar and Stephanie Teasley.

Scale up Slide

The intervention being briefly described is one of providing the tutor with student information intended to be used as the basis for conversation about performance, based on data and analytics of course. Scale up issues will follow.
By tagging onto the Business Objects corporate Business Intelligence Tool the project intended to ‘leverage’ resources and enhance uptake as the system scaled.

Nice to hear people doing this. There are clear overlaps between Analytics and BI and in my experience tapping into existing corporate services, governance etc is one way of gaining momentum quickly (though risky in terms of visibility, so be confident in your new service!)

A number of teething issues were identified in terms of system performance, data visualisation, crashing the LMS with 12K people online (remember to load test before launching).

Business Objects was helpful, but the decision has been made to migrate to an alternative corporate service (the speaker is a little fast, I missed the name).

Here’s the summary slide

Summary

For me this was atypical in that the IT department were charged with running an analytics project with little or no steer and came to the analytics team to roll out their research project. So some serious clashes there I’d imagine but no detail given. It was a short paper so one can excuse the lack of detail of the analytics system features and I suspect missed a lot of the negotiation detail in order to achieve the linkages to Business Objects.

An evaluation of policy frameworks for addressing ethical considerations in learning analytics. Paul Prinsloo and Sharon Slade.

Institutions gather a lot of data baout their students. The data policies in place aren’t keeping up with the use cases for that data. The talk will discuss frameworks for ethics.

The team believe that informed consent is now a requirement so that data student provide is correct and current and that students understand what the data is used for.

The potential for stereotyping is high in analytics and steps to limit allegations of misuse and harm should be taken.

Collection, analysis and storage from data outside of the home institution is becoming prevalent in analytics. Care must be taken to gain consent, protect the data, ensure the use cases are transparent and that misuse and harm are addressed.

Quite a lot of repetition in this one. Jisc commissioned a report on Risks and Ethics for Analytics which is rather good and freely available.

Here’s a slide on Beneficiaries

beneficiaries

It’s not intended as a good practice example though!

The rest of this talk was a lot of verbal reporting on analysis of policy examples at the OU and Unisa to highlight the aforementioned issues, or the gaps. In conclusion:

Conclusions

Here’s a slide from an entirely different presentation that caught my eye

Expected Results

Next up a presentation on Aggregating Social and Usage Datasets for Learning Analytics: Data-oriented Challenges. Katja Niemann, Giannis Stoitsis, Georgis Chinis, Nikos Manouselis, Martin Wolpers

The project joined up three data sets (portals) and analysed for patterns which is an unusual approach. I’d have expected the questions to be identified first then choose the data sources but maybe I’m old fashioned that way. Am afraid I’m unfamiliar with the CAM POrtal but that’s the first to be analysed. Oh my. It’s all gone a bit information architectures. Not really my bag am afraid.

Information Architectures

That’s the end of the session.

Last night I attended a SURF sponsored dinner where each course was accompanied with an analytics topic for conversation. We were asked to change tables as each topic arrived causing chaos for the restaurant serving staff but that aside was a challenging way of squeezing even more work from conference delegates. No rest for the wicked eh? Speaking of, here’s a shot of Shane Dawson as the starter topic is introduced.

Dinner and Analytics

Next up it’s a strem of Discourse Analytics. I’ve seen a bit of this before and it promised great things but didn;t really deliver at the time so here’s hoping things ahve moved on.

Analyzing the Flow of Ideas and Profiles of Contributors in an Open Learning Community. Iassen Halatchliyski, Tobias Hecking, Tilman Göhnert, H. Ulrich Hoppe (Full, Best Paper Nomination)

This one aims to characterise the flow of knowledge in knowledge creating communities using a tweaked version of Main Path Analysis. Full marks for mentioning the zone of proximal development. Am looking forward to that bit.

An example of collaborative knowledge construction is of course wikipedia.

Here’s the background

Background

Here we see the relations between artefacts, actors and documents as knowledge

relationships

The path analysis is based on citation links. Here’s a slide on the main path analysis. Am afraid this one is getting rather deep for me. In the wise words of Sheila McNeil ‘what does it all mean’? Let’s hope for enlightenment.

Main path analysis

I’m trying to drop onto sessions that offer real concrete systems / services with benefits but alas, they are proving elusive.

Remember, a DAG is a Directed Acyclic Graph, not a gypsy hound for hare coursing.

The presenter is giving us technical approaches to creating an analytic model. It’s a look under the bonnet. I think I’m more of a driver than a mechanic 🙂 Clever stuff though and nice to glimpse the mechanics of things. They’ve produced a ‘workbench’ for this sort of thing

Workbench

And here’s that zone of proximal development I was drawn to earlier

Zone of Proximal

Rather telling that the three papers in this track have been singled out as candidates for Best Paper. The conference isn’t seeking or rewarding systems in use with large student numbers or systems ready for wider uptake. Nor even systems ready for local uptake. It’s focused on theoretical underpinnings. One wanders who is bridging from these academic data scientists out to the vendors, the suppliers of best of breed corporate data systems for wider uptake. My suspicion is that that’s simply not going to happen. Though I’d be glad to be proved wrong. There aren’t even commercial sponsors here.

Next up we have Epistemology, Pedagogy, Assessment and Learning Analytics. Simon Knight, Simon Buckingham Shum, Karen Littleton

This one is a PhD paper on epistemology, assessment and pedagogy. Truth, accuracy and fairness are pillars of epistemology hence the application to assessment.

Aims

Denmark have opened up some exams to include internet access. Stephen Heppel thinks the UK exam system is fit for the 19th century not the 21st and that Denmark have it right.

Analytics might give us unprecedented access to seeing knowledge in action. Intriguing. A bold move in terms of assessment. I used to work in assessment and would caution that it’s a very visible and high risk area. While I can’t imagine the exam boards leaping into this just yet it is an intriguing concept.

Here are a few examples of epestimologic attributes that students might demonstrate as knowledge in action as the basis for assessment. Also noting the likelihood of automating that assessment.

Examples of epistemilogical behaviours

The team are interested in how people use dialogue as a frame for knowledge building. Natural language processing sits well with this with discourse as both context and c creator of context, the importance of dialogue in knowledge creation.

I’m rather drawn to this. In terms of potential to change the way we assess knowledge it seems on the face of it to have a great deal of potential. Nice work.

Last one for me today is An Evaluation of Learning Analytics To Identify Exploratory Dialogue in Online Discussions. Rebecca Ferguson, Zhongyu Wei, Yulan He, Simon Buckingham Shum

The mighty Rebeccas Ferguson is back with more analytics in online discussions. I heard a bit about this at the UK Solar Flare Jisc supported and Sheila blogged, and I think at LAK12. So it’s got provenance.

Rebecca is looking at discourse as language and dialogue are crucial tools in the generation of knowledge. Here are the three ways in which learners engage in dialogue

Discourse Analytics

And here are the key characteristics of exploratory dialogue

Insert Slidekey characteristics

The method is very labour intensive so the team branched out and asked for input from computational linguists. They suggested a self training framework

framework

All goes well until the final instance! So they suggested a more complex method called labelled features. This was OK but needed to take into account the topic or context. These pseudo labels can be described by an equation

Equation

They took it further by analysing nearest neighbours, which helped determine whether the label is valid. Then threw in the original 94 phrases. The framework was then manually coded to determine whether they agreed with exploratory and non exploratory. Here’s a summary of the methods combined

Combined Methods

And the difference? On reliability of identification the accuracy increased, precision showed a slight decrease, and on recall an increase.

The classifier allows the identification of knowledge generation. Pretty cool!

Insert Imageidentification

Red is knowledge creation, blue isn’t, height of peak is confidence and it’s run against real time elapsed. Also cool but even better it can atribute exploratory discourse by individual contributor. It can be used to motivate and guide people. It’s a real exam of the ‘middle space’ – cross discipline contributors coming together to do learning analytics. Here’s the conclusion slide

conclusions

Here’s a more detailed Discourse Learning Analytics paper presented on Monday at LAK 13

End of live blog today as I’m involved in a Panel Session next. My slides are here.

Panel: Recent and Desired Future Trends in Learning Analytics Research. Liina-Maria Munari (European Commission), Myles Danson & Sheila MacNeill (JISC), Sander & John Doove (SURF).

Day 1 Late PM; Learning Analytics and Knowledge Conference April 2013

What Can We Learn from Facebook Activity? Using Social Learning Analytics to Observe New Media Literacy Skills. June Ahn.

Now digital literacies are close to my heart. I’m helping oversee a Jisc programme in the area so keen to hear this talk. The aforementioned programme has been collating resources, advice and findings over the last 18 months and depositing them here. The project phase concludes July 13 while the 10 professional associations representing the majority of staff groups in UK HE runs until December. We have a webinar series free to attend with a back catalogue of recordings and will be promoting the work through professional association conferences in 2013.

So on with the LAK session on New Media Literacies and what we can learn from Facebook via the University of Maryland.

New Media Literacies are offered as any of the following;
Play, Performance, Simulation, Appropriation, Multitasking, Distributed Cognition (taking notes and sharing bookmarks and live blogging presumably) Collective Intelligence (effectively collaborating digitally) Judgement, Transmedia (the trajectory of stories via blogs, twitter and other platforms), Networking and Negotiation

Whereas the Jisc digital literacies were defined as;

ICT/computer literacy: the ability to adopt and use digital devices, applications and services in pursuit of goals, especially scholarly and educational goals information literacy: the ability to find, interpret, evaluate, manipulate, share and record information, especially scholarly and educational information, for example
dealing with issues of authority, reliability, provenance, citation and relevance in
digitised scholarly resources.

media literacy, including for example visual literacy, multimedia literacy: the ability to critically read and creatively produce academic and professional communications in a range of media

communication and collaboration: the ability to participate in digital networks of knowledge, scholarship, research and learning, and in working groups supported by digital forms of communication

digital scholarship: the ability to participate in emerging academic, professional and research practices that depend on digital systems, for example use of digital content (including digitised collections of primary and secondary material as well as open content) in teaching, learning and research, use of virtual learning and
research environments, use of emergent technologies in research contexts, open
publication and the awareness of issues around content discovery, authority,
reliability, provenance, licence restrictions, adaption/repurposing and assessment
of sources.

learning skills: the ability to study and learn effectively in technology-rich environments, formal and informal, including: use of digital tools to support critical thinking, academic writing, note taking, reference management, time and task management; being assessed and attending to feedback in digital/digitised
formats; independent study using digital resources and learning materials

life-planning: the ability to make informed decisions and achieve long-term goals, supported by digital tools and media, including for example reflection, personal and professional development planning

This talk is an analysis of FB features and activities mapped to the aforementioned New Media Literacies. So friend lists, member pages, status, links/photos, videos, networks.

Here are the regression results

Regression Analysis

All very well but in the words of someone far wiser than me…. So what?

The notion here is that FB is often seen as a distraction. The study has shown that users of the various features are developing new medial skills (to a greater or lesser extent). I didn’t see any analytics in this.

Next up Improving retention: predicting at-risk students by analysing clicking behaviour in a virtual learning environment. Annika Wolff, Zdenek Zdrahal, Andriy Nikolov and Michal Pantucek.

One of my own projects this one from the OU and fundeed through the Jisc Business Intelligence Programme. The team developed predictive models to identify which students would benefit from an intervention. Data sources were limited to VLE, Assessment and Demographic historical data. Quite key this. It’s not quite a live service but has institutional finance to become so imminently.

The number of clicks a student makes does not map directly to engagement. The project therefore built a number of classifiers. Here’s a slide to demonstrate that

Decision Trees

Decision Trees

The predictions in performance drop were extremely accurate. The models appear to be predict powerfully. The tam also note that after the third assessment then the Grade point Average (GPA) becomes the best indicator to use. Presume that’s because it’s more accurate and easier.

The most interesting finding was that a student who used to work in the VLE then stopped, or reduced activity compared to previous, all prior to an assessment was likely to fail that assessment.

I’ve popped the conclusion slide in below. Thanks Annika for the acknowledgement of funding via Jisc.

Conclusions

Last of the day it’s Open Academic Analytics Initiative: Initial Research Findings. Eitel Lauria, Erik Moody, Sandeep Jayaprakash, Nagamani Jonnalagadda and Joshua Baron. . I had lunch with Erik and discussed this open source implementation of a Purdue Course Signals sort of a thing. They have it patched into Sakai as well as BlackBoard and are about out of funding. It was supported by Gates foundation to the tune of USD 250K. He tells me he has stories of benefits realisation in terms of student retention and enhancements in efficiencies.

Question they sought to answer;

1. How good are predictive models?\
2. What are good model predictors?
SATs, GPA
Demographic
Sakai Event Log
Sakai Grade Tool
3. How portable were the models (across 4 different institutions, 36 courses at community colleges and traditionally black institutions so 1000+ students per semester)

The underlying data sources and system overview is summarised below

System

Much time was given over to the analysis and predictive modelling here by the analyst so not surprising. The performance measures used were accuracy, recall, specifity and precision. Unfortunately the speaker was rushing so I missed the definitions. Might be linked to Pentaho analysis.

Erik next discussed the action taken from the insights. Control group (no intervention), awareness group (had messages sent), OASE Group (intensive interventions). Some great graphs showing evidence of GPA enhancements and withdrawal rate decline but skipped through to fast to capture.

conclusions

Sadly a rushed presentation but some great evidence.

Day 1 Mid PM; Learning Analytics and Knowledge Conference April 2013

Multidisciplinarity vs. Multivocality, the case of “Learning Analytics”. Nicolas Balacheff and Kristine Lund. This one is a best paper nomination so we’ll see how it goes.

This is an academic exploration of the differences and overlaps between Learning Analytics and Educational Data Mining.

Learning Analytics vs Educational Data Mining

Historically
learning analytics (appeared 2009, 1st conference in 2011)
educational data mining (appeared in 2000, 1st conference in 2008)

I won’t repeat the methodology here, suffice to say it seemed a robust academic exercise (studies of published papers, vocabularies, keywords, scope, organisations etc)

Nice opportunity here to slide in an academic term ‘multivocal’, if like me it’s not a word you use regularly it simply means ‘having many meanings’. Multivocal research has many more impenetrable terminologies;

Educational Research

This paper is a clear vehicle to give Learning Analytics a lift by demonstrating in an academically rigorous way that the field is unique. It concluded that way.

Next up a panel session exploring the role of the data scientist (the sexiest job of the 21st century)

Each panel member described their career path culminating in their current role as data scientist.

Data Scientists

It’s an interdisciplinary career as evidenced by the variety of backgrounds, variety of current roles and descriptions. Mention here of something I discussed with Simon Buckingham Shum over lunch. Train the trainers. An international summer camp occurring later this year. More on that later. Here are a few of the suggestions;

Should we focus on building teams comprising relevant skills to the various tasks, or do we try to generate a new role of data scientist?
As there’s no clear definition (much like enterprise architect and many other recent roles) caution is wise. Don;t be only ‘this’ and not ‘that’.
Data Scientist isn’t a role, it’s just something you do
Last century vs this century – last century assessment was by multiple choice test, this century we assess simulation, conversation, contribution etc etc. Methodologies must evolve to reflect changes and opportunities. Don’t define a data scientist as it will become out dated.
Look for longevity. Address the issues that we’ll be tackling for a long time to cme
Data Scientists are becoming more involved in a wide variety of tasks. They need a higher profile.
Business schools and elsewhere are offering courses on analytics. The predictive aspects seem to lack socio cultural aspects and policy.

Day 1 Early PM; Learning Analytics and Knowledge Conference April 2013

Next up at LAK 13 Leuven I’m joining a full paper session entitled ‘Interpreting Data Mining Results with Linked Data for Learning Analytics: Motivation, Case Study and Directions’ by Mathieu D’Aquin and Nicolas Jay.

All papers can be found in the following drop box

Mathieu is that rare thing, a data scientist.

A data scientist

This is the subject of a panel discussion later today and if we believe the hype of the conference organising panel, it’s going to be an important and in demand role in society an one that is currently lacking capacity.

Mathieu starts us off with two great slides which I repeat below. The first is a naive view of learning analytics. The second includes the really interesting bit ‘Interpretation’.

Simple View of Learning Analytics

Simple view 2 of learning analytics system

This is going to slide into the uber technical I think, but I’ll first echo my own point earlier today when I hinted that analytics is all well and good but it’s only of use if;

a) the course is sound
b) the instruction is sound
c) the student are engaged (and engaged enough to look at the analytics and action the insights)
d) the student and instructor have the appropriate data literacy skills to make sound interpretations

Anyway, on with the linked data view.

Linked Data

And here’s a view of the web of linked data as of 2011 (apparently it’s now grown too complex to represent in this manner.

Web of Linked Data

You can’t see the detail but it has a bubble for University data and one for research publications among media providers such as BBC etc(!)

Mathieu next showcased the OU open data project
data.open.ac.uk hosts datasets obtained from public data repositories at the Open University and applications making use of these data. Currently, the datasets relate the publications, courses and Audio/Video material produced at the Open University, as well as the people involved in making them. All these data are available through standard formats (RDF and SPARQL) and are (in most cases) available under an open license (Creative Commons Attribution 3.0 Unported License).

The OU has a Course Profile Facebook Application that entices student to share the courses they have, are and intend to complete with friends. This allows them to represent each students’ trajectory as a sequence of courses. From 8806 sequences (students) they obtained 126 sequential patterns occurring in at least 100 sequences (course A —> course E —> course M etc). The need for background information becomes apparent. We need the context of the courses themselves in order to draw inferences from the patterns. Once we have that we can build relations that apply to the items of patterns eventually providing a hierarchy of patterns. Are you with me so far?

More linked data

Next we are able to explore the hierarchy and realise these benefits

Benefits of linked data for analytics

My own conclusions are a little lacking here! We have patterns of courses as student trajectory, we know what those courses are, we have other course related information. I presume it allows us to predict successful pathways. Hey ho.

So the session was about the importance of linked (big) data. I’d draw attention to a session I blogged a month ago on Analytics and Institutional Capabilities where we heard from Ranjit Sidhu (Sid) (@rssidhu) that often big data projects = big waste of money. Sid counselled to look to local data first. This LAK session seems to have done both. It’s local data but enhanced by the Facebook App.

Day 1 AM; Learning Analytics and Knowledge Conference April 2013

I’m fortunate enough to be attending this third international conference on Learning Analytics (I made an attempt at live blogging the second, last year here) hosted by University of Leuven

Leuven City

Here’s the official site with abstracts etc

1. Learning Analytics as Middle Space
Dan Summers described the conference theme; ‘The Middle Space’

middle space

The conference will explore the “middle space” within which Learning and Analytics intersect, and seeks proposals for papers and events that explicitly connect analytic tools to theoretical and practical aspects of understanding and managing learning.

2. Marsha Lovett Cognitively Informed Analytics to Improve Teaching and Learning
First up we have a keynote by Marsha;
Marsha Lovett

Dr. Marsha Lovett is Director of the Eberly Center for Teaching Excellence and a Teaching Professor in the Department of Psychology, both at Carnegie Mellon University. Throughout her career, Dr. Lovett has been deeply involved in both local and national efforts to understand and improve student learning. Her book How Learning Works: 7 Research-Based Principles for Smart Teaching distills the research on how students learn into a set of fundamental principles that instructors can use to guide their teaching. Dr. Lovett has also developed several innovative, educational technologies to promote student learning and metacognition, including StatTutor and the Learning Dashboard.

Marsha poses the question ‘How do we tell how well our students are learning?’
Quizzes, homework performance, comparing to previous students / classes etc are traditional ways. Analytics offers new ways giving better and fuller insights into learning performance.

In a rich modern course experience by a well respected tutor Marsha found that ‘Students spend 100 + hours across the term yet show only learning gains of 3%’ and asks ‘what improvements can be made by applying analytics as an adaptive, data driven course ‘ and found that 18% learning gain occurred in less than 50 hours.

I have to applaud Marsha for giving us some concrete quantitative evidence for performance changes, something that has been lacking in the majority of analytics projects in my experience.

Marsha makes the point that analytics allows predictions and greater understanding but this is only useful if it creates targeted action. This is an aspect we at Jisc built into our definition of analytics and something I preach – analytics is only as good as the actions one takes. See our Analytics Series for more.

Marsha proposes three key ingredients to good learning analytics being;

1. Informed by cognitive theory
Where we’d expect to see a straigh line between errors made and practice attempts in a learning setting (the more practice, the less errors. Marsha shows the reality

jagged curve

The lack of linearity is explained in that each problem requires sub skills and when the frequency of practice of these is taken into account a linear relationship becomes apparent.

Smoother curve

The analytics have helped us parse a domain into constituent skills. Thus teachers can track students learning and adapt instruction to meet students needs while students can monitor their own strengths to focus their practice where they most need it.

2. Built on solid course design
Instructional activities are effective to the degree that they
2.1 Align with the skills students need
2.2 Offer opportunities for repeated practice
2.3 Provide targeted and timely feedback

3. Meeting user needs
Instructors typically have access only to averages or distributions of student scores on graded activities
But these come too late. What they really need are up to date actionable insights and this is where analytics can help. They can even provide the actions eg suggestions for appropriate supportive materials / exercises.
Students typically only pay attention to the grade so again there exist opportunities to introduce up to date actionable insights.

The insight triggers mentioned were a little weak here and I’d be keen to here more about them. The actions might be suggestions as to which areas need more attention and where to go to achieve that.

Both Instructors and Students need ‘meaningful, actionable inferences from the data’ and Marsha suggests that to achieve this visualisations should be quick to comprehend, flexible enough to drill down to detail, customisable to meet individual needs.

So there’s the theory of it all. So what?

Well in this case Marsha is showcasing a system called ‘The Learning Dashboard’. This has been designed addressing the previous three key ingredients.

The data exhaust created by each student in the learning management system are sent to the learning dashboard, analysed and performance with actionalble insights aloing with suggested actions are provided as neat visualisations. Voila. Learning analytics in motion.

It’s great to see a mature system in production that’s not Purdue Course Signals!

The system has tackled a number of interoperability issues. As my colleague Sheila McNeil of Jisc CETIS has been known to say ‘interoperability never goes away’. It’s a subject Jisc, SURF and Educause have highlighted as key to the success of analytics and we fell we have a role to play here. We’re flagging a concern that as analytics gathers pace, valuable data could become locked in / given away to vendors and perhaps even sold back to the sector. I wander to what extent Marsha has considered this in investing so much in her Learning Dashboard system.

So Marsha, the acid test, ‘what’s the business case?’ What qualitative data do you have to wow us as to improvements in student experience, retention, cost savings, efficiency improvements, the sorts of Benefits we at Jisc identified in our Business Intelligence InfoKIt

Improved decision-making (anecdotal)
Better strategic planning (anecdotal)
Better risk management (anecdotal)
Competitive advantage (quantitative)
Income generation (quantitative)

Efficiency gains (quantitative) Y – efficiency of interventions for student and instructor. Only need 7 assessments rather than 20 to mark
students learning to learn – communicate to investors the worth of life long learning

Performance benchmarking (anecdotal and quantitative)
Student satisfaction (quantitative)
Student retention (quantitative)
League table ranking (quantitative)
Improved data quality (quantitative)

Little time for questions so I decided to attend the follow up discussion session on the Carnegie system presented by Marsha.

My questions for Marsha;
Q1. What are the triggers eg the Derby Dartboard from my own project portfolio

Derby Dartboard

A. I didn’t ask this as someone else couched a similar question. In summary ‘Nothing as sophisticated as Derby’

Q2. Interoperability and vendor lock in (to what extent is there a risk that as with systems such as WebCT locked our content in, vendors will lock our data exhausts in selling the interpretations back to us and elsewhere as well as locking us in to a solution

Q3. Assumptions; Students that they are engaged AND data literate (those who are not engaged won’t action the insights analytics offers them, those lacking data literacy won’t comprehend the visualisations) and Instructors that they are good, their courses are good AND they are data literate (badly designed and delivered courses – and I recently undertook one of these – won’t benefit from analytics, instructors with weak data literacies won;t declare them and will struggle to comprehend the visualisations)

Q4. What are the benefits and qualitative data to back them up? Is the business case based on that opening statistic of 50 hours for 18% improvement or is there more?
Student retention (quantitative)
Yes it increases but also we see enhanced perseverance on gateway / stem courses opening up opportunities top succeed in later learning and allows the focus of human effort to be placed on authentic tasks such as collaborative learning and let the analytics do the heavy lift on actionable insight identification
Efficiency gains (quantitative)
Efficiency gains in terms of the interventions for the student and the time spent learning, but also the instructor and their time spent pursuing only the highly effective and labour efficient learning exercises and dropping those that are high labour and poorly effective. For example only needing 7 assessments rather than 20 to mark.
students learning to learn – communicate to investors the worth of this new way of designing learning and impact on life long learning skills and therefore repeat business for Universities

Questions from the audience

Q. What are the possibilities of capturing data exhaust outside of the VLE.
A. Mobile devices for lab work would be nice, voting systems in class.

Q. How does research into instructional design impact on practice
A. That’s the role of the support section Marsha heads up. Proactive co-design with end users and a multi disciplinary team. They don;t use students yet – this is an aspect we at Jisc promote as the student voice is a powerful one and the educational opportunities are significant

Q. What are the limits of analytics?
A. What are the limits of educational technology? Marsha has been wroking with faculty who are moving courses online and is concerned about loss of ‘soft skills’ in the process (eg discussion, modelling, etc). So she’s mentioning the move by instructors to put too much online and badly. Marsha postulates whether capturing this data would be helpful.

Analytics and Institutional Capabilities at JISC CETIS Conference March 13 2013

It’s Cheltenham Races as well as Open Educational Resource week and the launch of phase 2 of our Jisc CETIS Analytics Series with the first case study (Derby University) available now.

Cheltenham 2013

I’m celebrating the two by attending Jisc CETIS Conference 2013. Today I’m blogging Martin Hawksey (prolific Tweeter, @mhawksey, and data guru), my compadre Sheila McNeil @sheilmcn (the drive behind much of the JISC CETIS Analytics Series) and a bunch of delegates for a long session on the aforementioned at Aston Lakeside. Full session details here.

Aston Lakeside

Martin proposes to run through the dreams, realities and nightmares of analytics. Ranjit Sidhu (Sid) (@rssidhu) is here. Sid is behind ‘Sector Statistics’, something that came to my attention a year or so ago being a shared service joining up cros sinstitutional data sets and providing analytics for those paying to take part. Sid gave a lightning talk yesterday warning about the perils of Big Data = Big Projects = Big Wastes of Money.

Martin ran a pre session questionnaire and displayed a visualisation about delegate backgrounds and interests. This brought up the issue of data literacies – can we all interpret the graph? Mixed responses so he explained for us.

Hawksey Graph 1

The questionnaire asked about competency with data manipulation and found that there were no gurus coming forward.

Some great slides here, particularly liked the nightmare analytics scenarios of students being thrown off courses before they fail based on a failure prediction form the analytics.

Nice quote from Tony Hirst (@psychemedia) (Martin and Tony tweet about data analysis into the small hours) – all charts are lies.

Another quote from Ben Fry (Ben presented at that dashboarding event I was at a couple of weeks ago)
Graphs can be a powerful way to represent relationships between data but they are also a very abstract concept, which means that they run teh danger of meaning something only to the creator of the graph. Everything looks like a graph, but almost nothing should ever be drawn as one.

Dashboarding – an illegal torture method whereby senior managers are gagged and Big Data poured onto their face until they pass out (see also waterboarding). Danson 2013.

Mark Stiles brought up the issue of defining the questions before wasting resource analysing the data. A couple of years ago I attended a Gartner Big Data and Analytics conference (before my blogging days) where someone suggested spending 80% of analytics project budget defining the questions. Then do it again.

Next up we have a series of lightning talks.

1. Wilbert Kraan
Course data project at Bolton University using new XCRI feeds considering student records, module descriptions, timetable data and external data sets; HESA, Student Satisfaction Survey etc.
Now Bolton University developed a Jisc funded workload model tool and have been uusing it to help out with a financial crisis over student numbers. They’re making posts redundant at present but I see they are hiring a BI expert.

2. Mark Stiles
Common Core IMS Standard and publishers clamouring to crank out content, so a heads up presumably

3. Martin Hamilton
Analytics for green energy usage

4. Brian Kelly
Tools for data collection and inference to be drawn outliers are interesting, comparisons might identify good practices and bad etc

5. Shane of PebbelPad
Gets asked by customers for more and more data about how people use their ePortfolio system but has concerns about the validity of what is being attempted and anxieties that maybe inferred by some people who may vote with their feet. The data might be valuable, but by mining it we may undermine its value

6. Martin Hawksey
Quick mention of John Campbell and Purdue Signals project. This comes up time and time again. Martin advocates keeping analysis simple. He consumes into google spreadsheets and bolts on widgits, gadgets and gisoms for visualisations as needed. That the tools has macro capability and scripting.

7. Ranjit Sidhu (Sid) (Statistics into Decisions)
It’s a new world of data but should we bother?

Brave New World

Tell me what you want me to say and I’ll make you a graph.
Sid says there is no truth in data. Decide what you want to communicate and identify the data to demonstrate it is the premise. this avoids becoming lost in a sea of data.
Are we becoming more intelligent (in our data use) or just institutionally covering the tracks of our ignorance? Be brave enough to say when the data is of no use.
Big Data is not new. IBM were doing it 20 years ago, It is just dimensions and measures. So Sid is no Big Data promoter. He thinks it’s a fad and argues for more precision when considering goals and ROI. Like Hawksey he is a proponent of small data. It’s cheaper and quicker. If you don;t do anything meaningful with small data, why would you do anything with big data? Is he a cynic with a smile, or a realist?
Sid showed the Unistats web site. It was expected that students would use it to select universities based on performance criteria. It runs at only 7 visits a day. Well, 8 today,

The key to making data useful is in the human interpretation to first identify then answer the important questions.

Sid works with local data. He starts reading VC statements. PG and International Dashboards are usually the first he produces. Web site customer journey is key in terms of navigation. Undergraduate path takes them to UG data then UCAS to apply. Postgraduate has its own path. On 16/8/12 Clearing changed everything in terms of a change in undergraduate activity and behaviour. Recruitment to meet targets became a purely competitive market. The fees effect was seen across the sector. The prospective students became very discernable clients.

The two worst web pages are a 404 (not surprisingly) and a duff search page that fails to find what the student wants and offers poor alternatives. Sid notes this results in an 80% drop off effect therefore universities m=should concentrate on getting the course information visible and making it look appealing so it sells. Clearing dashboards are a low hanging fruit. Note it’s local data again.

Google advertisements by Universities are hugely important and hugely expensive. Sid states that many Universities are being killed in this competitive environment and reports panic in the sector.

How can you compare Robert Gordon with LSE? What questions can you ask? It’s absolutely moronic. Well said Sid.

Exit Sid, enter Mark Stubbs and his circle of analytics

Case study one had a student spending 2006 – 2009 evaluating the impact of the institutional VLE. In particular does VLE usage affect student success? What sorts of interaction yield the best outcomes?

Manchester Met Analytics VLE Cycle

Trends identified covered a breadth of activities including number of content styles students had visited, discussion tool interaction, assessment tool interaction, number of log ons, percentage of 9 – 5 hits and more. The project managed to match around 18K students through interactions and behaviours to degree classification. As one might imagine this yielded a Big Data sample (albeit a local one) requiring analytical techniques and tools. Significance was explored using random forest analysis.

Here are some examples of visualisations produced

Forest Graphs

At risk failure alarm bells included high usage outside 9 – 5, early finish or late start in the year VLE access. Categorised for interaction type, with more analysis to be undertaken. Hmmm. So is this really an example of a time consuming and resource intensive big data project to determine the obvious?

Of course not. This is @thestubbs in action. The team went on to include NSS scores for their courses. The strongest predictor was the question about whether the course was well organised and running smoothly. It was NOT the question about assessment which is widely held as the main predictor for success. The team undertook more analysis against other NSS questions with equally unexpected results. Of course NSS has its critics so one must bear that in mind. For MMU course organisation was the most important aspect to address for improvement. Other analyses are bing undertaken. Meanwhile course organisation falls in terms of statistical relevance as others increase. The next steps are illustrated below

Next Steps For Manchester Met Analytics

Next we have Jean Muton (@myderbi). I’ve worked a good deal with Jean on our Relationship Management programmes. No need to get bogged in that though as we just launched an InfoKit which includes a case study on this talk, video and advice. Basically Jean looked at identification of students not engaging early on with the University, hence either at risk of drop out or not achieving their full potential. Jean is also big on Service Design and I’d recommend this to you. Here’s a presentation I ran with Jean and Simon yesterday on that InfoKit.

The team came up with the concept of Engagement Analytics. As Jean was the subject of a case study today I’ll send you there. Helpful to know how to get to these things as more are due between now and July 13. Open the Observatory, Choose the Analytics Tab, Scroll down to the blogs, choose the appropriate one, click through to the the case study. Jean shared an anecdote about the ‘bicycle diary’ at an HEI which was completed by staff who cycled to work. When the book was full it was taken to registry who shelved it. When the shelf was full the bicycle diaries were archived in the library. On inspection, the archives went back to the second world war. Cyclists were given extra food rations. Considering the student lifecycle and touch points demonstrating engagement, what processes are actually valid and why do we do them the way we do?

Next we’re treated to a talk by Simon Buckingham Shum of the OU Knowledge Media Institute. Simon @sbskmi is on the team behind SOLAR and LAK 13.

Simon describes Learning Analytics as Evolutionary Technology where it’s concerned with the usual educational paradigms of engaging, better assessed with better outcomes delivered at scale. It becomes revolutionary technology by offering insight into interpersonal networks, quality of discourse and writing, lifelong learning dispositions, problem solving strategies (process analytics – a new one on me) and life wide learning.

Simon aired a few OU operational issues including data warehouse, data dictionary, data marts and cubes for data sets, exploration using appropriate tool (SAS for example) – the latter is a skill in shortage at present. Simon calls this role a data wrangler. To move to action. Which fits nicely with the Jisc analytics definition. Phew.

Simon went on to talk about predictive analysis;

OU Predicitive Modelling

Quick plug by Simon for the Jisc funded RETAIN project (one of mine) which looked at VLE data as prediction indicators for student success and failure not disimilar to the material Mark Stubbs aired earlier. That one came from our Business Intelligence Programme and we’re launching a new InfoKit on that in April with case studies, video and plenty of peer advice. It’ll appear here (the old one is there).

Simon went on to show us some really complex tag clouds and visualisations for social analytics. This was first published at LAK 2012 in Vancouver buy Rebecca ferguson @R3beccaF and will be updated at LAK in Leuven 2013.

Discurse analytics next – it has a way to go but seems a great topic for a researcher like Simon and his colleague Rebecca.

We’re just missing a mention to @dougclow learning analytics researcher, lecturer and fellow live blogger (he’s much better that me).

What’s next for Learning Analytics? Well, not surprisingly Simon aired FutureLearn, MOOCS and analytics. He also aired Staff and Skills issues and what it means to be an educational data scientist. I’m really keen on this as, through my involvement in the Jisc digital literacy programme, I can forecast the need for a high level of data literacies across the workforce in the not too distant.

Anyway, Simon always pops his slides up on his blog so look there if this is your thing.

And so I must leave CETIS 2013. It’s been a real pleasure catching up with folks. Here’s a shot of some excellent colleagues enjoying academic discourse in the Sack of Spuds last night.

Sack of Spuds

@rsherratt @sclater @hughdavis and Rikki Prince

Analytics Resources from Jisc

Analytics for HE seems to be gaining interest. In the wise words of Mary Poppins, Here are a few of my favourite things

May 2013 Educause have released their Ethics, Big Data and Analytics Model for Application and cited our Jisc legal and ethics paper

April 2013 I’ve been involved in discussions with Educause, Surf and Contact North about Learning Analytics. Some great discussions. Here are a few resources of common interest we’ve identified:
Jisc Strategic ICT Tools
Edcuause LEARNING ANALYTICS: MOVING FROM CONCEPT TO PRACTICE (2012)
Educause LEARNING ANALYTICS: A REPORT ON THE ELI FOCUS SESSION (2012)
Educause LEARNING ANALYTICS: THE COMING THIRD WAVE (2011)

March 2013 The Jisc Inform has a piece entitled ‘how can I use analytics to benefit my students’

February 2013 The Times Higher Education Supplement published an article covering Jisc analytics

January 2013 New publication from Jisc Protect Your Business, Look after your information

January 2013 Try my own blog post describing our Analytics Series of in depth papers for all aspects of the HE business

January 2013 Research Analytics article by my collaegue Neil Jacobs of Jisc

December 2012 UNESCO have released a briefing on learning Analytics

December 2012 This months Jisc Inform Has a quick jargon free article on analytics to support learners and refers to the December Jisc report ‘Activity Data – delivering benefits from the deluge

November 2012 Jisc put together an Analytics Briefing for Senior Managers

November 2012 Activity Data is described succinctly in this blog post by my colleague Andy McGregor

March 2012 Jisc report on the Value and Benefits of Text Mining

November 2011 Beautifully designed online Jisc resource ‘Exploiting Activity Data in the Academic Environment
Enough is as good as a feast (Michael)

Dashboarding for Peak University Performance

26 February 2013 and I’m attending a 1 day conference hosted by Simpson Associates on Dashboarding for Higher Ed. The tag for the event is #peakhe

East Midlands Conference Centre

Feeling really positive about this one. There are over 100 delegates and first impressions from coffee networking are some really interesting people are here. I already bumped into Gary Tindell of UEL, one of our Jisc Business Intelligence Stars Gary, Patrick and I co presented a session focused on the UEL national comparison / benchmarking BI system at UCISA CISG Conference in November (also blogged here). Gary told me the Jisc investment of just 50K allowed work that has paved the way to a 7 million pound initiative with local government. Not a bad ROI. Being the brave sole I am I have sat at a round table knowing no one. I’m flanked left and right by University Planners (members of the National Planners group) from St Andrews and Kingston. Vicky Goddard (former chair of National Planners) helped out with the development of our V1 BI InfoKit. I’m informed that the new Chair of the Planners group is Lucy Hodson (Aberystwyth), though Vicky Goddard (Liverpool) and Anita Wright (Liverpool) are still involved. Planners are a key target audience for our new BI InfoKit (due to launch April 2013) and our exisiting Analytics Series (2013, blog post here)

1. DVC Nottingham
First up we hear from the DVC of Nottingham and I’m pleased to recognise echos of issues, approaches, experiences and achievements we encountered in the Jisc BI Programme culimating in the new (launch April 2013) Jisc InfoNet BI InfoKIt. Descriptions of frustrations with access to the right information at the right time but also noting a tendency to focus on the aspects Nottingham are good at (over play strengths) and underplay weaknesses. The Management Information Hub has demonstrated the value of MI if collected, analysed and presented appropriately along progress to current strategic plan as well as working toward the next one. Access to the system is devolved beyond the executive board and a rosy picture has been painted. Top down commitment cannot be underplayed. Collection is one thing but meaning is imperative – how will the information be used? How do we convert complex business data to formats that are meaningful to varied staff roles. Postulating as to the deeper and broader challenges others will face;

Sense of purpose for the whole oprganisation (data relevance across the entire organisation and related to strategic plan)
Ensuring employee engagement in terms of;
Data literacies
Action planning
Engender trust in the information (data provenance)

Good MI can bridge board members perspectives vs what is really going on

Highlights what is going on but also why allowing informed decisions to be made to address these issues and enhanced targeting of resources, track them and identify when they have been achieved.

2. Simpson Associates
The organisers of this event provided some HE focused case studies identifying the breadth of their consultancy offer around Information Management covering business and technical expertise. They’re citing a BI Maturity Model. Turns out the one they use is the old Gartner model (clearly still valid). At Jisc we developed one of these 3 years ago and have moved our thinking forward so this has evolved into BI Implementation Stages in BI InfoKit 2. I’d like to think we’re a little ahead of the game in Jisc.

Simpson cite the Gartner (May 2012) BI, Analytics and Performance Management CIO Concerns as evidence that BI, Data Warehousing and related issues are current issues.

Simpson methodologies include BI, Scorecards, Data Warehouse, Collaboration, Budgeting and forecasting etc. while they use the Gartner BI Maturity Model which is quite old now (August 2010) and focused on organisational maturity rather than BI characteristics.

Gartner BI Maturity Model

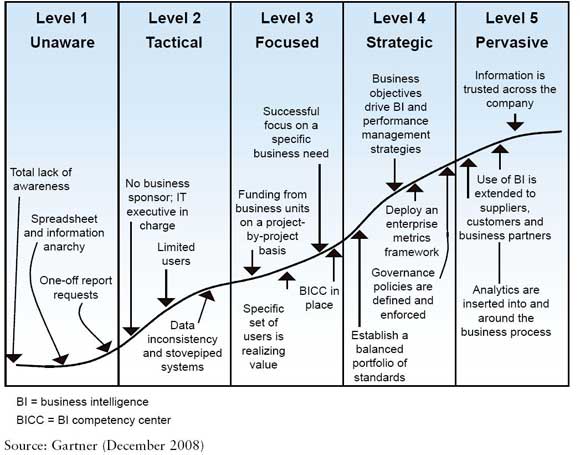
Simpson use this as the framework for their BI consultancy.

Delivering value to customers quickly and incrementally (across the maturity levels) using sound practice and best of breed systems (Cognos etc) is the Simpson approach using existing resources such as data warehousing.

A Gartner Level 2 example was a focus on student planning; organisational benefits are quickly demonstrated

Leves 3 example was a Student Progression module

More examples were discussed from outside the HE Sector based on higher maturity levels which makes me wander whether Simpson struggled to find Levels 4 and 5 in UK HE. I suspect this is more a reflection of their client list progression being ongoing, rather than the sector itself and we’ll perhaps hear more of this later in the agenda.

3 IBM Cognos 10 Platform
Slick presentation by IBM showing their existing dashboarding for Student Retention through Cognos 10. Student satisfaction, retention, efficiencies, cost savings and how technology can help. IBM focus is on ‘actionable insights’ a phrase we at Jisc use in our definition of Analytics. So moving from knowledge to action through insights via, presumably BI and perhaps analytics. We shall see.
A single slide presentation is being revealed showing Finding Relevant Information, IT Bottlenecks vs Siloed Users of Finance, Planning and Faculty. Dashboards were presented on Retention, Retention vs Target, Satisfaction, Segmentation, What if / Scenario Planning and noting that by giving the siloed users access to the dashboards the move to actionable insight is much quicker and more effective. Here’s a snippet from Jisc on Actionable Insight

“Analytics is the process of developing actionable insights through problem definition and the application of statistical models and analysis against existing and/or simulated future data”

A 25% figure of student attrition improvement was cited. I’ll chase up on the source.

Steven Few has been cited as a primary data source (book author) for BI and Visualisation and Data Warehousing.

4. Case Studies: Warwick University on Business Analytics
Warwick seem to be up at level 5 or the Gartner model and at the highest end of our own – that of accurate predictions and forecasting. Cognos 10 and Tableau are the current technologies but they use the Gartner Magic Quadrant and state they are quite mercenary about their choice of technologies and not wed to any single supplier.

‘Experts often possess more data than judgement Colin Powell
‘It is a capital mistake to theorise before one has data’ – Sir Arthur Conan Doyle

Introduces the concept of ‘Signal Advantage’. Using BI / Analytics / MI to aid competitive advantage is critical in the current environment. Smart organisations embrace it. – Warwick.

A number of critical paths to success were revealed, in particular the appointment of an analyst and a superb relationship with the department responsible for corporate information. A recent development is ‘pumping’ data from HESA Heidi (presumably the ‘open’ API) directly into their own data warehouse. Warwick also revealed difficulties in recruitment to support BI and an 11% growth forecast in the industry by Gartner. So a role here for HEI to provide skilled graduates presumably.
Velocity of data was touched on – some data is real time, some is annual (HESA). Am awaiting to hear about Volume and Variety (3Vs of Analytics). Warwick are about to start analysing social media so entering the world of Big Data.
Warwick noted that ‘reports’ might be consumed across a spectrum of operational to strategic.The talk will be more about the strategic end.
Warwick analyse every individuals research performance. In the Jisc BI Programme University of Bolton undertook a work load model BI tool while Huddersfield and Glasgow examined research performance issues and all three produced case studies. Have a look at the Jisc InfoNet Case Study Wiki.
Nine considerations for Data Visualisations were presented based on work by XXX
Warwick shared their Analytics Journey plans from 2006 – 2016 starting with student number forecasting through research income forecasting, HR Reporting, HESA Benchmarking, space dashboards and more with plans to develop social media and predictive analytics to understand the student journey, student view point, attainment, risk of non completion. The latter I know as Learning Analytics. It has its own conference (LAK 2013 Leuven, April 2013) and research association (SOLAR). Warwick aspire to predict employability of undergraduates and issues across all aspects of the business. Most impressive scale and achievements here.
Analytics has been embedded in process through the challenge of departments via the dashboards.
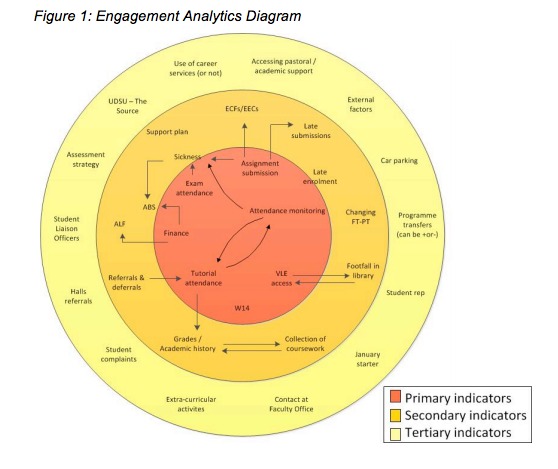
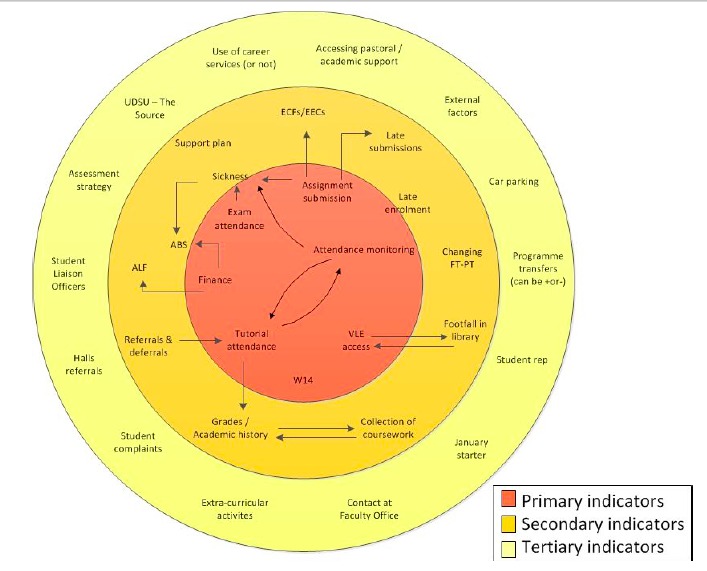
A mention here to student campus services analysis via Till data, Cashless records and customer demographics. You may not be sure why one would go to this detail on shopping facilities but I know this as ‘Engagement Analytics’ which can help enhance the wider student experience and provide tertiary indicators of attrition and is the subject of Jisc primed work at Derby University

Derby Engagement Analytics

Warwick displayed a series of dashboards showing performance trends for research as applications and awards and able to drill down through departments to individual staff. This helps the staff retention strategy. There’s nowhere to hide at Warwick! The Jisc funded BI Project at UEL has similar dashboards including HESA Data so allowing national benchmarking. See the aforementioned case study wiki and presentation (the CISG 2013 conference web site has a video of that presentation).

Space shows a traffic light of usage. Sometimes these back up the obvious. Later lots of 17.00 – 18.00 are very poorly used. Wednesday afternoons are very poorly used. They probably knew this already – an example of development to give answers you already have I suspect.

NSS (National Student Survey) is as one would expect but allows the ‘challenge’ of departments (and presumably targets for improvement).

Success factors include (again)
Leadership buy in, develop and retain skills, stakeholder involvement, links to strategy, embed in practice, data security.

5. Case Studies: Nottingham MI Hub
Well, it’s Nottingham, but not as we know it. Second presentation from Notts, this time about the previously mentioned MI Hub at the centre of the success we heard about earlier. Liverpool developed a BI Competency Centre as part of their Jisc funded BI Project and am guessing this will be a smilar concept. See the case study wiki for more on that.
Forst note of action is that reporting against flawed strategies is itself flawed. So undertaking an ‘As Is’ analysis is important. We found that reflecting that against the maturity model characteristics, identifying a desirable ‘to be’ state (matched against strategy) helped gain leadership buy in and a better chance of success.

Can you sail under a Pirate? The only rules that matter are what a man can do and what a man can;t do (Captain Jack Sparrow)

Project principles included doing the work right and once, user centred design, latest thinking in data visualisation, minimal training and support for users of the MI. Potentially useful throw away comment; ‘There’s no point in working with the luke warm, they’ll come on board eventually’.
As one might imagine this presentation reflects heavily on the previous Nottingham one.
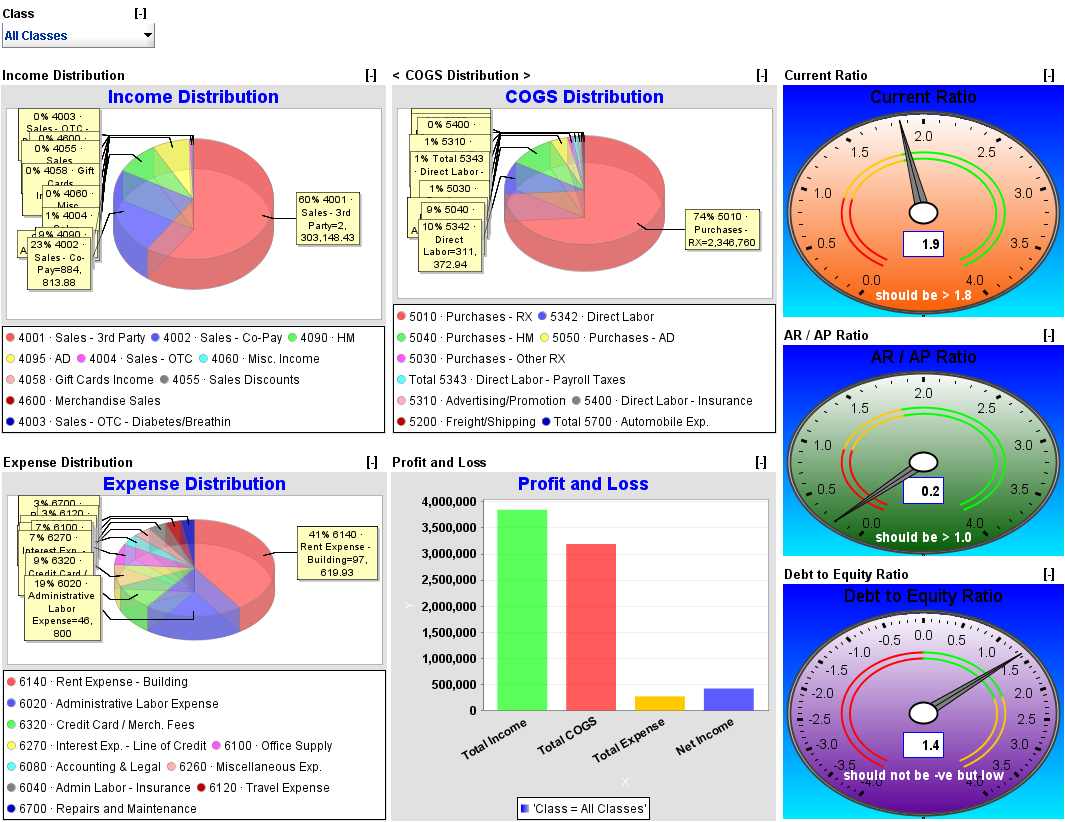
Much advice here about warehousing and visualisations (avoid pie charts, gauges and superfluous colour, draw attention to key information, apply ruthless consistency). Not sure I agree with all of this to be frank – better perhaps to work with end users as co-producers. Beware – MI Users have little experience of BI Systems. Next steps are predictive modelling (that’s long hand for Analytics)
We were next presented with some detailed examples of Nottingham Dashboards. Nice use of presentation software to highlight detail of these complex dashboards – have seen Prezi do this effectively. THe importance of grey scale majority using colour only to draw attention to key summaries.
Applications data is pulled into the warehouse fortnightly (nice issue of velocity of data).
Domicile of applicants shows that chemistry is the majority, the dashboards can show whether this is a wider trend and actionable insight presumably becomes evident – is there a wider untapped market here and why? Student type is updated weekly, the aspiration is to do this daily (bot no justification of why one would need this, I’d advise caution that one doesn’t get over enthused by the possibilities here)
Benchmarks, benchmarks, benchmarks. Everyone loves a good benchmark. Lots here, lots at Warwick and lots in the Jisc work on BI to date.

Next up we have a series of breakout sessions intended to be interactive so I propsoe to share the titles here and perhaps some findings if not already covered previously.

Breakout 1. Developing Dashboards: Sharing notes from your experiences
A panel discussion about moving your dashboard projects forward whatever your maturity level.
Based on the aforementioned Gartner Maturity model a show of hands revealed that within participants levels 2 and 3 prevale, no one was at level 1. 2 or 5.
Next we were asked a series of question
Q1. What advice would you offer to those at earlier stages, which seemed a shame given these folks have already achieved the transitions required. Responses included;
Senior Manager buy in
Deliver results quickly in the project
Q2. Technology issues for success
Clarity vs simplicity, relentless consistency (of screen furniture), demonstration of benefits and relevance to roles
Give confidence in the data by providing reports that end users are used to. Give them what they think they want as well as what the dashboard can achieve
Put BI on top of BI – how is the dashboard being used, how are they using it, where to focus developer energy
Don’t underestimate the degree to which people feel threatened
Q3. To what extent are dashboards made available to externals
Little evidence of this but more expected this afternoon
Q4. How to control information architecture eg renegade staff, systems and data collections
Much discussion here, governance, provide better systems, educate staff, centralise, take small steps toward an enterprise data warehouse etc
Q5. How to win the user demand for whizzy widgets over wrt simple visualisations
Have courage in your convictions
Prescribe their experience, provide no option

Dashboard

Q6. How do you prioritise demand for features?
Strategic priorities take precedent in terms of broader themes eg research, student experience, admissions based on evidence of challenges, capabilities, pay back etc
Make your financial people happy – they hold the purse strings to the University
Get senior manager involvement in setting priorities, highly important to show them what is possible, don;t just ask them what they think they want, help work out what they actually need, do mock ups, hone in on a priority and don’t start too big
Don’t get bogged down in data quality issues, you may spend an age solving them and achieve no BI at all
Know the enemy

Q7. Is there potential for a shared service for BI dashboards
Incredibly difficult. Every institution has a different set up so there’s no one size fits. There is opportunity in knowledge sharing in terms of what is possible in analysis. The assets to commercialise are knowledge ones so difficult to achieve
What does competition mean in HE – would we want to agree a standard approch to MI in HE? It would be hard to find common ground due to differing capabilities, respurces, aspirations. Why would levelling out BI capability make economic sense?

Breakout 2. Student Populations in Income Forecasting: Different approaches to common challenges
Well attended session perhaps indicating a widely felt issue. Demonstrations of different dashboards. One you had to be there for really! Nice idea of personal sandbox to allow users to experiment with their own reports.

6. Arizona State Case Study, John Rome
73K students, largest in the US, big issues around student experience.
Focus here is on enabling student success. Reliance on a student portal which includes performance dashboards and an analytics driven ‘eAdvisor’ – a course recommendation service based on competency requirements. Claims 84% retention rate.
Data warehouse is mature and ‘vast’ including activity data (to granularity of clicks recorded on web systems), residential / life data (how is their room mate doing) and much more.
Claims a data warehouse started kit (vendor supplied solution) can only achieve 35% of capability.
Various dashboards shown here, impressive scale of implementation, many seen already today.
Several triggers for an ‘outreach event’ described – if a student requests a transcript they’re probably thinking of leaving. Students who don’t post a personal photo are some of the most at risk of withdrawing etc
Financial records are included so students can see any outstanding issues, presumably this is also an outreach trigger event
A data driven culture has been created, policies security and data governance are included
4% of IT staff are BI and data warehouse people and this includes students as employees

7. The art of data visualisation, Andy Kirk
Andy has a book out. He’s from an analytics background and introduces visualisations beyond the bar graph. As one might expect – this was extremely visual! Nice work Andy but not something I can record here. Reminds me of some of the work I’ve seen @psychemedia undertake. You’d probably get on well.